

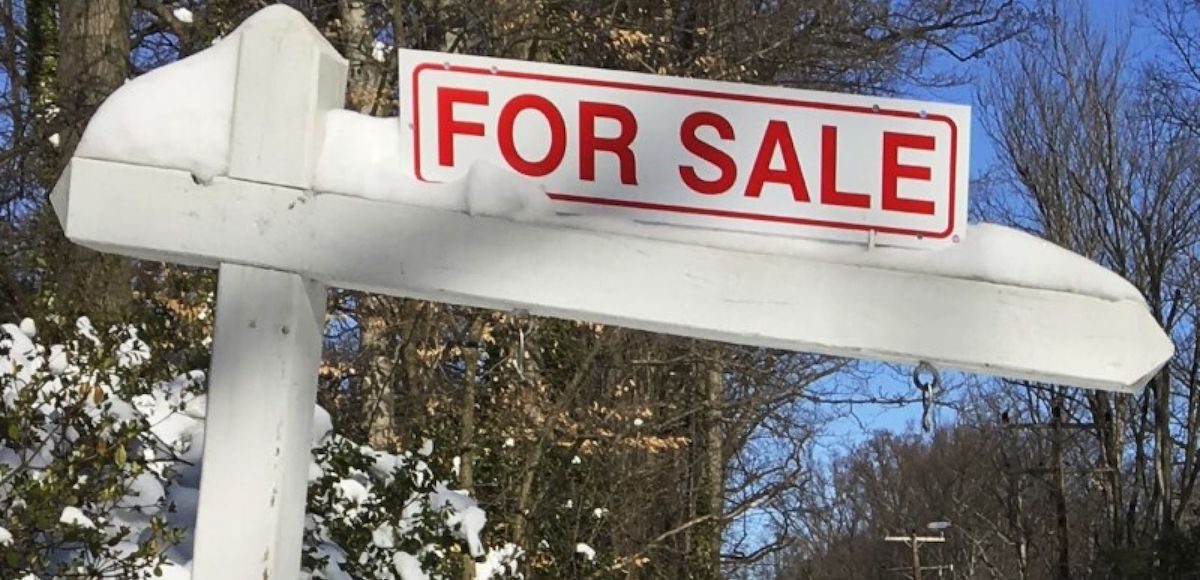
A house-for-sale sign is seen inside the Washington DC Beltway in Annandale, Virginia January 24, 2016. (Photo: Reuters)
Federal Housing Finance Agency (FHFA) House Price Index (HPI) finds U.S. house prices rose 1.7% in the first quarter (1Q) of 2018. House prices rose 6.9% from the 1Q of 2017 to the 1Q of 2018, less than the 7.4% median forecast.
FHFA’s seasonally adjusted monthly index for March was up 0.1% from February, less than the 0.6% expected gain and the smallest gain in over 3 years.
Still, offsetting weakness in March is unusual strength in February, which is revised 0.2% higher to an 0.8% monthly gain. The annual was revised 0.2% higher to 7.4%.
“Home prices continue to rise across the U.S. but there are signs of tapering,” Dr. William Doerner, FHFA Senior Economist said. “Since housing markets began to rebound in 2012, house price appreciation has been positive because demand has outpaced supply.”
“In the last month, however, some regions reflect a slowing or even flattening of house price growth.”
Home prices rose in all 50 states and the District of Columbia between the 1Q of 2017 and the 1Q of 2018. The top five areas in annual appreciation were: 1) Nevada 13.7%; 2) Washington 13.1%; 3) Idaho 11.1%; 4) Colorado 10.6%; and 5) Utah 9.9%.
Home prices rose in each of the 100 largest metropolitan areas in the U.S. over the last four quarters. Annual price increases were greatest in Las Vegas-HendersonParadise, NV, where prices increased by 17.1%. Prices were weakest in Tulsa, OK, where they rose 0.8%.
Of the nine census divisions, the Pacific division experienced the strongest 4Q appreciation, posting a 9.5% gain between the first quarters of 2017 and 2018 and a 2.6% increase in the 1Q of 2018. Annual house price appreciation was weakest in the East South Central division, where prices rose 5.3% between the 1Q of 2017 and 1Q 2018.
The HPI is calculated using home sales price information from mortgages sold to, or guaranteed by, Fannie Mae and Freddie Mac.


