
By now, you’ve all seen the headlines: “Best January market performance in 30 years” and “Best single month for stocks since 2015”.
Was January the month that saved the market? Or, was the market performance this month merely a natural “mean reversion” from a ridiculously oversold condition that we were left with at the end of 2018?
With multiple factors in play, it helps to hit the rewind button just to refresh our vision of what happened.
It’s amazing how far we’ve come in just 4 to 6 weeks!! During 10 calendar days in December, investors were deluged with the fear mongering narrative of a mythical economic death spiral that would lead to an inevitable recession in 2019, and yes, many market mavens and media talking heads were rooting for it. I don’t need to tell you why.
From Monday, December 17, through Monday, December 24, an already weak stock market went into a free fall. This 6-day stretch culminated in the capitulation low on December 24.
How convenient that the 2.5% to 3% decline on Christmas Eve was a very lightly attended half day of trading, wedged in between a weekend, and Christmas Day, when markets would obviously be closed.
How convenient that the 5 days of non-stop selling the prior week took place when nearly every Mutual Fund, Hedge Fund, and professional money manager had closed their books for the year.
Basically, this means “No New Positions,” just cleaning everything up for year-end reporting.
If you were a conspiracy theorist, or even Mike Clancy, there would be no better time to envision a cabal of big money bears, global financial terrorists, and out of control computerized algorithms all foaming at the mouth over the prospects of “breaking” the U.S. Financial Markets.
You think I’m crazy?
The ubiquitous Jim Cramer has called for the U.S. Securities and Exchange Commission (SEC) to investigate the nature of the selling in the stock market on the half day of trading, December 24.
I agree with him 100%. But I digress. It’s a New Year.
Let’s talk market performance in January and how it sets up the rest of the year.
Keep in mind, the market had a strong rebound the last 4 days of 2018, that helped set the stage for the January rally. It was also critical that we had 2 trading days, December 26 and January 4, within a 6-day span where the Up Volume was 95% of total volume.
This is indicative of investor reaction to an EXTREMELY OVERSOLD market condition, and a very bullish indicator for an intermediate-to-longer term market move, not just a “blip”.
The Dow Jones Industrial Average (^DJI) closed January 31 at 24,999.67, just teasingly below the psychological benchmark of 25,000. The DJIA rallied +7.2% in January and settled the month +14.7% higher than the December 24 capitulation low.
Including trading on Friday, Feb 1, the DJIA has now closed above the 200 day Moving Average of 24,985 each of the last 3 days. The longer the DJIA can hold its 200 day MA, the more confident investors will become that there is a solid base for the Blue Chip Benchmark to move higher.
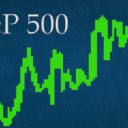
The S&P 500 (^SPX) closed at 2704, a +7.8% gain for the month, and +15% above the Christmas Eve low. This was the first close above the 2700 benchmark for the S&P 500 since December 4.
The S&P 500 remains below the 200 day moving average by 1.4%, but within shouting range for the first time in 2 months.
On Friday, Feb 1, after straddling the benchmark 2700 level all day, the S&P 500 posted a modest gain of +2.43 to close at 2706.53. For the second day, the S&P 500 held above the 2700, including a weekly close above the benchmark on Friday
The NASDAQ Composite (^IXIC) closing at 7281.74 is a +9.7% gain for January, and gives the NASDAQ a +17.5% lift off the capitulation lows from December 24..
While the NASDAQ was aided this week my Apple Inc. (AAPL) gaining +6% and Facebook, Inc. (FB) gaining 10% after their earnings reports midweek, the tech heavy index had a fractional decline Friday of -17 points.
This was largely attributable to Amazon.com Inc. (AMZN) declining over -4% in response to slightly lowered revenue guidance following their Q4 earnings.
Like the S&P 500, the NASDAQ at 7263.87 is within shouting distance of its 200 day moving average of 7450 for the first time in a couple months.
Looking Forward
I’m already starting to see comments in an assortment of financial media that February is historically one of the worse months for stock market performance.
Clearly, it would be unrealistic to see a repeat of the gains from January, but with momentum behind a steadily improving economy, and the potential for a resolution of the trade dispute with China later in the month, it might be wise to throw that historical template in the recycle folder.
Stay tuned.


smirking kataisa ? #SmilingWhileWhite ⭐ ?? / February 2, 2019
Thank you, President Trump! @potus ?????
/
?? Afterseven ⭐ ⭐ ⭐ / February 2, 2019
@Peoples_Pundit dems are waiting til September 2020 to tank the market
/