
Slightly more than halfway through the first quarter (Q1) of 2019, U.S. stock markets are facing their first significant test of major resistance levels.
This comes after performance during the first half of Q1, at a rate that is frankly unsustainable on an annualized basis.
Major market averages have YTD gains ranging from +11% for the Dow Jones Industrial Average (^DJI) to better than +16% for the Russell 2000 (^RUT).
While this rally was clearly set up by an extremely oversold condition that climaxed with the December 24 capitulation lows, market averages are now encroaching structural resistance levels that will be hard to break through without much heavier volumes than we’ve seen so far this month.
Let’s take a closer look:
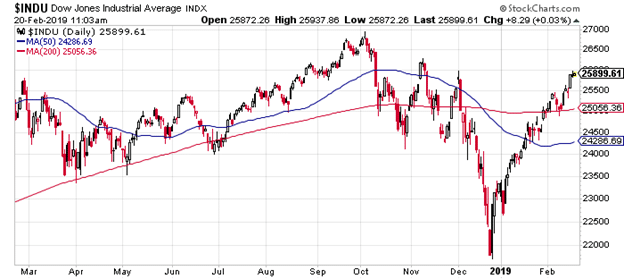
The ^DJI at 25,891 is +11% YTD. Tuesday was the highest close for the ^DJI since November 9 of last year. At yesterday’s intraday high the ^DJI was less than 40 points from 26,000 benchmark. The ^DJI has only posted 2 closes above the 26,000 marker since October 10 of last year. We expect the market will experience significant resistance from here to the 26,200 level.

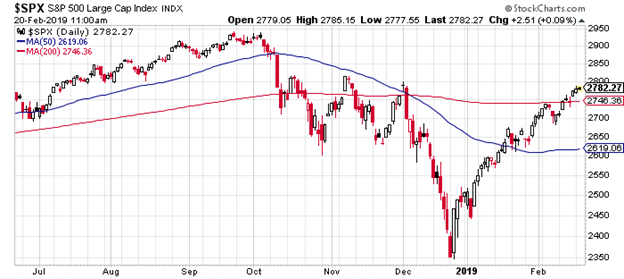
The S&P 500 (^SPX) at 2779.76 is +11.75 YTD. This is less than 1% from the 2800 barrier, which proved to be a major stumbling block during Q4 last year.

The ^SPX only posted 4 daily closes above 2800 following the selloff in early October. This happened on 2 days back to back in mid October, and 2 more back to back in early November.
Each occasion was followed by close to a 6% correction to the downside. On December 3 the^SPX closed at 2790 after “touching” the 2800 level intraday. This was followed by a brutal 3 week selloff that culminated with the Dec 24 low.
The 2800 level is more than a psychological resistance of a Big Round Number for the ^SPX. It’s a technical level that was met with significant, and aggressive selling, on 3 occasions from mid October through early December last year.
I’m not saying that we can’t go through it to the upside, but I doubt it will happen without at least 1 failed attempt, and without a heavy appetite of volume from the buyers.
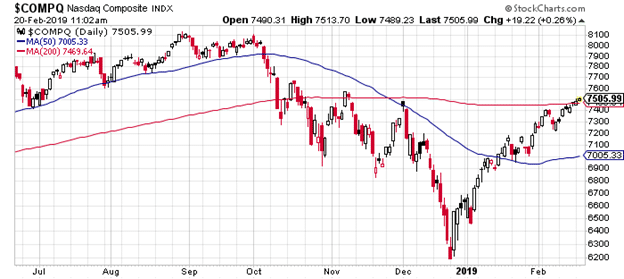
The NASDAQ Composite (^IXIC) closed Tuesday at 7486, +12.8% YTD, easily within range of the 7500 benchmark, which the ^IXIC has not closed above since November 7th and 8th last year.

The rally attempts in Q4 produced 3 lower highs for the ^IXIC in October through Early December before the death spiral that set up the December 24 lows.
The relative weakness in the ^IXIC was a byproduct of over performance in the preceding 3 years, compounded by issues of cyber security and data privacy among most Social Media Titans.
The ^IXIC is just slightly above its 200 day moving average of 7470, having closed above it by a very thin margin each of the last 3 days.
Mid-morning Wednesday, the ^IXIC is fractionally north of the 7500 level, but we traded through that marker intraday Tuesday as well, before settling marginally lower.
Watch these levels on PPD Markets:
| Index | Level |
| Dow (^DJI) | 26,000 |
| S&P 500 (^SPX) | 2,800 |
| NASDAQ (^IXIC) | 7,500 |
This will likely take at least a few days and possibly a couple weeks to resolve.


