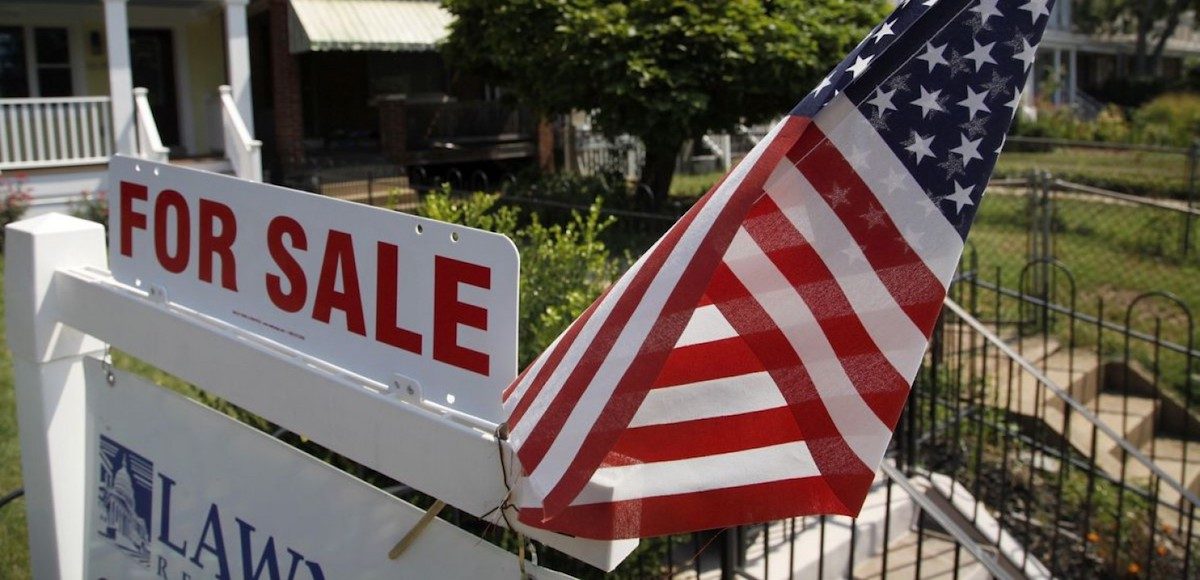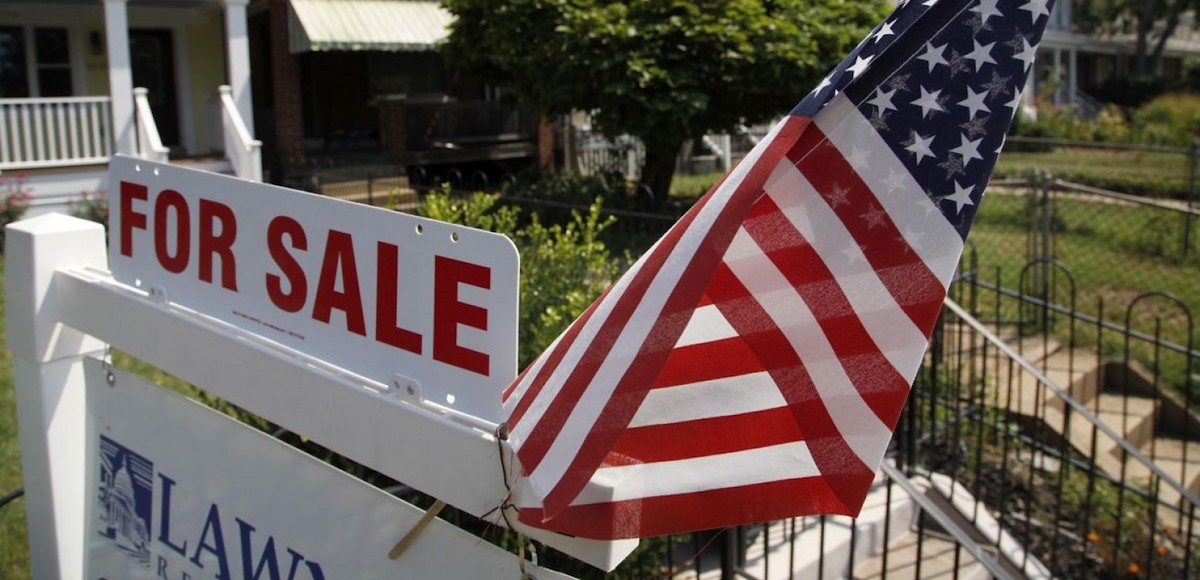

A U.S. flag decorates a for-sale sign at a home in the Capitol Hill neighborhood of Washington, August 21, 2012. (Photo: Reuters)
The S&P CoreLogic Case-Shiller U.S. National Home Price NSA Index covering all 9 U.S. census divisions posted a 6.4% annual gain in April, down from 6.5%. The headline NSA from S&P Case-Shiller confirms what was seen as a spring slowdown in price gains.
“Home prices continued their climb with the S&P CoreLogic Case-Shiller National Index up 6.4% in the past 12 months,” says David M. Blitzer Managing Director and Chairman of the Index Committee at S&P Dow Jones Indices. “Cities west of the Rocky Mountains continue to lead price increases with Seattle, Las Vegas and San Francisco ranking 1-2-3 based on price movements in the trailing 12 months.”
The 10-City Composite annual increase came in at 6.2%, down from 6.4% in the previous month. The 20-City Composite posted a 6.6% year-over-year gain, down from 6.7% in the previous month.
“The favorable economy and moderate mortgage rates both support recent gains in housing. One factor pushing prices up is the continued low supply of homes for sale,” Mr. Blitzer added. “The months-supply is currently 4.3 months, up from levels below 4 months earlier in the year, but still low.”
Seattle, Las Vegas, and San Francisco continue to report the highest year-over-year gains among the 20 cities. In April, Seattle led the way with a 13.1% year-over-year price increase, followed by Las Vegas with a 12.7% increase and San Francisco with a 10.9% increase. Nine of the 20 cities reported greater price increases in the year ending April 2018 versus the year ending March 2018.
“Looking back to the peak of the boom in 2006, 10 of the 20 cities tracked by the indices are higher than their peaks; the other ten are below their high points,” Mr. Blitzer continued. “The National Index is also above its previous all-time high, the 20-city index slightly up versus its peak, and the 10-city is a bit below.”
Before seasonal adjustment, the National Index saw a month-over-month gain of 1.0% in April while the 10-City and 20-City Composites reported increases of 0.6% and 0.8%, respectively. After seasonal adjustment, the National Index posted a 0.3% month-over-month increase in April. The 10-City and 20-City Composites posted 0.1% and 0.2% month-over-month increases, respectively.
“However, if one adjusts the price movements for inflation since 2006, a very different picture emerges. Only three cities – Dallas, Denver and Seattle – are ahead in real, or inflation-adjusted, terms.”
Nineteen of 20 cities reported increases in April before seasonal adjustment, while 17 of 20 cities reported increases after seasonal adjustment
“The National Index is 14% below its boom-time peak and Las Vegas, the city with the longest road to a new high, is 47% below its peak when inflation is factored in.”


