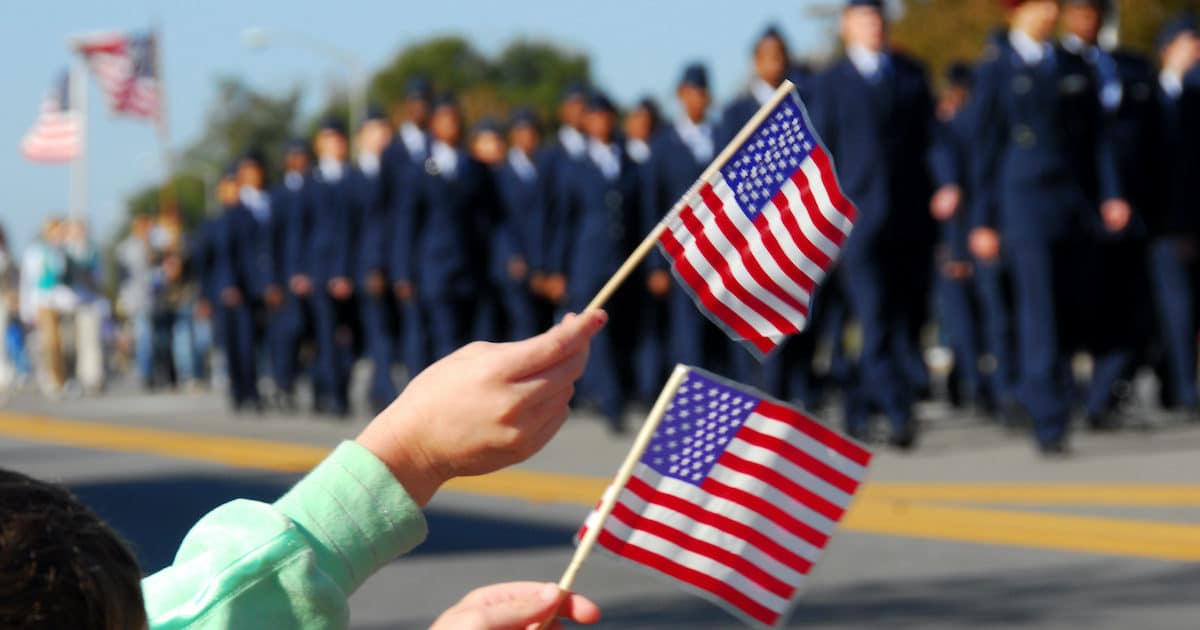

Veterans Day originated as “Armistice Day” on November 11, 1919, which marked the first anniversary of the end of World War I.
Of the 4.7 million who served — including 4.1 million in the U.S. Army and 600,000 in the U.S. Navy — the Defense Department official death toll for the period from 1 April 1, 1917 to December 31, 1918 stands at 116,516. The U.S. lost more soldiers and sailors to disease (63,114) than combat (53,402).
In 1926, the U.S. Congress passed a resolution establishing an annual observance, and November 11 became a national holiday beginning in 1938.
In 1954, President Dwight D. Eisenhower signed legislation to change the name to Veterans Day as a way to honor those Americans who served in all wars, in all U.S. armed forces. The day honors military veterans with parades and speeches across the nation and a ceremony at the Tomb of the Unknowns at Arlington National Cemetery in Virginia.
The following statistics are sourced by the U.S. Census Bureau.
Veteran Share of the U.S. Population
There are an estimated 17,964,242 veterans in the United States of America, representing 7.1% of the total population.
Veterans By Gender
Of those 17,964,242 in total, 1,652,798 are female veterans, or 9.2%. The remaining 90.8% totaling 16,311,444, are male.
Veterans By Era
Vietnam era veterans are the largest single bloc at 6,384,412, or 35.5%. World War II and Korean War veterans now only represent 2.7% and 7.3% of the total veteran population, respectively. There are 3,803,899 Gulf War (8/1990 to 8/2001) veterans, or 21.2%, and 3,764,194 Gulf War (9/2001 or later) veterans, or 21.0%.
Veterans By Race
There are 14,698,804 white veterans (81.8%), including 13,783,229 or 76.7% who are not Hispanic or Latino. White veterans represent a higher share of the total civilian population at 73.8%.
Hispanic or Latino veterans total 1,284,854, or 7.2% of the veteran population. That’s significantly less than the 16.2% share of the total civilian population.
Black veterans, totaling 2,150,689 or 12.0%, closely reflect the overall share of total civilian population at 12.3%. The 141,438 veterans who are American Indian and Alaska Native (alone) also mirror the share of the total civilian population at 0.8%.
While Asians represent 5.9% of the total civilian population, the 308,983 Asian veterans represent 1.7% of the total veteran population.
The total civilian population identified as two or more races is 2.4%, closely reflecting the 2.1% of the veteran population for that racial group.
Veterans By Age
At 4,752,276, veterans 65 to 74 years old represent the largest age bloc, at 26.5%. Veterans 75 years and over total 4,238,431 and represent 23.6%. The third largest are 35 to 54 years old, at 4,158,398 or 23.1%.
There are 3,183,388 veterans 55 to 64 years old, or 17.7%. Unsurprisingly, 18 to 34 years old represent 29.8% of the total civilian population, but only 9.1% of the veteran population.


