

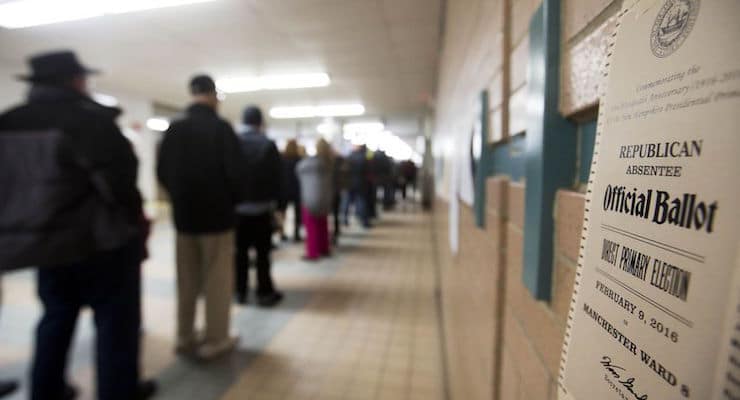
A ballot is posted to the wall as voters wait in line to cast their ballots for the New Hampshire primary at a polling place Tuesday, Feb. 9, 2016, in Manchester, N.H. (Photo: AP/David Goldman)
A Gallup poll showing three in four voters are giving “quite a lot” of thought to the upcoming election, a sign Election 2016 voter turnout could top 2008. Prior to the 2008 presidential election, which eventually saw voter turnout at the highest level in 40 years, a Gallup poll conducted at the end of May showed a level of interest similar to the levels measured this year.
| Quite a lot | Only a little | Turnout percentage, Election Day | |||||||||||||||||||||||||||||||||||||||||||||||||||||||||||||||||||||||||||||||||||||||||||||||||
|---|---|---|---|---|---|---|---|---|---|---|---|---|---|---|---|---|---|---|---|---|---|---|---|---|---|---|---|---|---|---|---|---|---|---|---|---|---|---|---|---|---|---|---|---|---|---|---|---|---|---|---|---|---|---|---|---|---|---|---|---|---|---|---|---|---|---|---|---|---|---|---|---|---|---|---|---|---|---|---|---|---|---|---|---|---|---|---|---|---|---|---|---|---|---|---|---|---|---|---|
| % | % | % | |||||||||||||||||||||||||||||||||||||||||||||||||||||||||||||||||||||||||||||||||||||||||||||||||
| 2016 | 75 | 21 | N/A | ||||||||||||||||||||||||||||||||||||||||||||||||||||||||||||||||||||||||||||||||||||||||||||||||
| 2008 | 73 | 20 | 58.2 | ||||||||||||||||||||||||||||||||||||||||||||||||||||||||||||||||||||||||||||||||||||||||||||||||
| 2004 | 64 | 29 | 56.7 | ||||||||||||||||||||||||||||||||||||||||||||||||||||||||||||||||||||||||||||||||||||||||||||||||
| 2000 | 42 | 43 | 51.2 | ||||||||||||||||||||||||||||||||||||||||||||||||||||||||||||||||||||||||||||||||||||||||||||||||
| Question on thought given to the election was not asked in May-June 2012 | |||||||||||||||||||||||||||||||||||||||||||||||||||||||||||||||||||||||||||||||||||||||||||||||||||
| MAY GALLUP POLLS IN 2000, 2004, 2008 AND 2016; THE AMERICAN PRESIDENCY PROJECT, VOTER TURNOUT IN PRESIDENTIAL ELECTIONS | |||||||||||||||||||||||||||||||||||||||||||||||||||||||||||||||||||||||||||||||||||||||||||||||||||
Looking at the table above, we can see a clear correlation. In the 2000 and 2004 presidential elections, which were lower turnout elections, smaller percentages said in May that they had given quite a bit of thought to the election. Less than half of Americans in May 2000 said they were paying a lot of attention and the voter turnout rate was the third-lowest (only 1996 and 1988 were lower) since 1924.
In 2000, when George W. Bush defeated Al Gore, only a little more than half of eligible voters (51.2%) cast a presidential ballot.
Gallup did not measure thought about the election in the May-June period of the 2012 election, which produced a 54.9% turnout rate. In a July poll that year, 64% said they were thinking about the election quite a lot — fewer than in July 2008, about the same as in July 2004 and more than in July 2000.
Republicans today are far more enthusiastic than in June 2008, when incumbent Republican President George W. Bush’s approval rating was below 30%. Then, only 35% of Republicans and leaners said they were more enthusiastic than usual, and 51% were less enthusiastic. Now, 51% of Republicans are more enthusiastic and 43% less enthusiastic.
For Democrats and leaners, the situation is reversed. In June 2008, with Barack Obama on the way to being their party’s nominee, 61% were more enthusiastic and 25% less enthusiastic. Now, 43% are more enthusiastic and 50% less.
| All adults | Democrats and leaners | Republicans and leaners | |||||||||||||||||||||||||||||||||||||||||||||||||||||||||||||||||||||||||||||||||||||||||||||||||
|---|---|---|---|---|---|---|---|---|---|---|---|---|---|---|---|---|---|---|---|---|---|---|---|---|---|---|---|---|---|---|---|---|---|---|---|---|---|---|---|---|---|---|---|---|---|---|---|---|---|---|---|---|---|---|---|---|---|---|---|---|---|---|---|---|---|---|---|---|---|---|---|---|---|---|---|---|---|---|---|---|---|---|---|---|---|---|---|---|---|---|---|---|---|---|---|---|---|---|---|
| % | % | % | |||||||||||||||||||||||||||||||||||||||||||||||||||||||||||||||||||||||||||||||||||||||||||||||||
| May 18-22, 2016 | |||||||||||||||||||||||||||||||||||||||||||||||||||||||||||||||||||||||||||||||||||||||||||||||||||
| More enthusiastic | 46 | 43 | 51 | ||||||||||||||||||||||||||||||||||||||||||||||||||||||||||||||||||||||||||||||||||||||||||||||||
| Less enthusiastic | 48 | 50 | 43 | ||||||||||||||||||||||||||||||||||||||||||||||||||||||||||||||||||||||||||||||||||||||||||||||||
| Jun 15-19, 2008 | |||||||||||||||||||||||||||||||||||||||||||||||||||||||||||||||||||||||||||||||||||||||||||||||||||
| More enthusiastic | 48 | 61 | 35 | ||||||||||||||||||||||||||||||||||||||||||||||||||||||||||||||||||||||||||||||||||||||||||||||||
| Less enthusiastic | 37 | 25 | 51 | ||||||||||||||||||||||||||||||||||||||||||||||||||||||||||||||||||||||||||||||||||||||||||||||||
| GALLUP | |||||||||||||||||||||||||||||||||||||||||||||||||||||||||||||||||||||||||||||||||||||||||||||||||||
There have been three other notable shifts in enthusiasm from 2008 to now, H/T Gallup:
- In 2008, Gallup measured Americans’ enthusiasm to vote just after Hillary Clinton gave up her bid for the Democratic nomination; this year’s poll was conducted as she stood on the threshold of becoming the first female presidential nominee of a major party. Nevertheless, among Democratic and Democratic-leaning women, 59% in 2008 were more enthusiastic than usual about voting and 31% were less enthusiastic. But this year, 40% are more enthusiastic and 53% are less enthusiastic.
- Among ideological moderates from either party, 48% were more enthusiastic than usual in 2008 and 39% less enthusiastic. Now 38% are more enthusiastic and 56% less enthusiastic.
- Conservatives’ enthusiasm has grown, while liberals’ has faded. Fifty-two percent of conservatives are more enthusiastic this year, compared with 40% in 2008; at the same time, 48% of liberals are more enthusiastic now, compared with 63% in 2008.
That said, it is entirely possible that enthusiasm–for both parties–will rise further post-Labor Day, when voters typically begin to pay even closer attention to the race. In the last three presidential election cycles, enthusiasm within the parties hit there highs in the month before the election.
The survey data strengthens the argument supporting new voter participation and high turnout, as well as mirrors turnout in the primary contests. That is particularly true as it relates to Republicans. The presumptive nominee Donald J. Trump received more primary votes than any other candidate in the history of the party. He surpassed G.W. Bush’s record after the West Virginia Republican primary.


Richard D. Baris / June 9, 2016
Testing the waters. Ooh. It’s lovely.
/