


President Ronald Reagan, left, the conservative standard-bearer with deep libertarian notes, and President Barack Obama, right, who wants to be the liberal big government standard-bearer, with deep modern liberal notes, which Reagan said resembles fascism.
As a fiscal policy economist who believes in individual liberty and personal responsibility, I have two goals.
1. Replace the corrupt and punitive internal revenue code with a simple and fair flat tax that raises necessary revenue in the least-destructive and least-intrusive manner possible.
2. Shrink the size of the federal government so that it only funds the core public goods, such as national defense and rule of law, envisioned by America’s Founding Fathers.
Needless to say, I haven’t been doing a great job. The tax code seems to get worse every year, and even though we’ve made some progress in recent years on spending, the long-run outlook is still very grim because there’s hasn’t been genuine entitlement reform.
But I continue with my Sisyphean task. And part of my efforts include educating people about the Rahn Curve, which is sort of the spending version 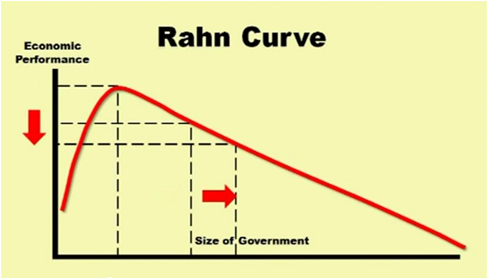 of the Laffer Curve. It shows the non-linear relationship between the size of government and economic performance.
Simply stated, some government spending presumably enables growth by creating the conditions (such as rule of law and property rights) for commerce.
But as politicians learn to buy votes and enhance their power by engaging in redistribution, then government spending is associated with weaker economic performance because of perverse incentives and widespread misallocation of resources.
I’ve even shared a number of videos on the topic.
The video I narrated explaining the basics of the Rahn Curve, which was produced by the Center for Freedom and Prosperity.
A video from the Fraser Institute in Canada that reviews the evidence about the growth-maximizing size of government.
A video from the Centre for Policy Studies in the United Kingdom that explores the relationship between prosperity and the size of the public sector.
Even a video on the Rahn Curve from a critic who seems to think that I’m a closeted apologist for big government.
Now we have another video to add to the collection.
Narrated by Svetla Kostadinova of Bulgaria’s Institute for Market Economics, it discusses research from a few years ago about the “optimal size of government.”
If you want to read the research study that is cited in the video, click here. The article was written by Dimitar Chobanov and Adriana Mladenova of the IME
The evidence indicates that the optimum size of government, e.g. the share of overall government spending that maximizes economic growth, is no greater than 25% of GDP (at a 95% confidence level) based on data from the OECD countries. In addition, the evidence indicates that the optimum level of government consumption on final goods and services as a share of GDP is 10.4% based on a panel data of 81 countries. However, due to model and data limitations, it is probable that the results are biased upwards, and the “true” optimum government level is even smaller than the existing empirical study indicates.
Two points in that excerpt are worth additional attention.
First, they understand that not all forms of government spending have equal effects.
Spending on core public goods (rule of law, courts, etc) generally are associated with better economic performance.
Spending on physical and human capital (infrastructure and education) can be productive, though governments often do a poor job based on a money-to-outcomes basis.
Most government spending, though, is for transfers and consumption, and these are areas where the economic effects are overwhelmingly negative.
So kudos to the Bulgarians for recognizing that it’s particularly important to restrain some types of outlays.
The other point that merits additional emphasis is that the growth-maximizing size of government is probably far lower than 25 percent of economic output.
Here’s what they wrote, citing yours truly.
…the results from the above mentioned models should not be taken as the “true” optimal level of government due to limitations of the models, and lack of data as already discussed. As Dan Mitchell commented, government spending was about 10% of GDP in the West from the end of the Napoleonic wars to World War I. And we do not have any data to think that growth would have been higher if government was doubled or tripled. However, what the empirical results do show is that the government spending should be much less than is the average of most countries at the moment. Thus, we can confidentially say the optimum size of general government is no bigger than 25% but is likely to be considerably smaller because of the above-mentioned reasons.
And here’s their version of the Rahn Curve, though I’m not a big fan since it seems to imply that government should consume about one-third of economic output.
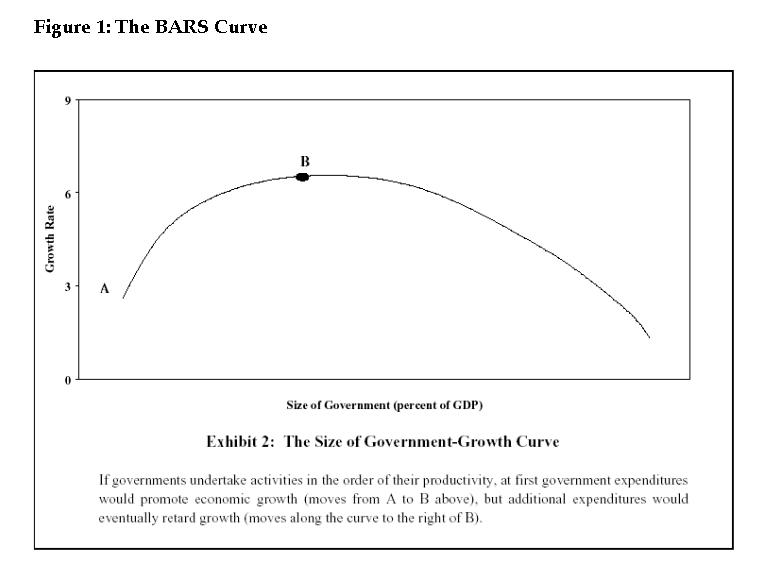
I much prefer the curve to show the growth-maximizing level under 20 percent of GDP.
 Though I often use a dashed line to emphasize that we don’t really know the actual peak because there unfortunately are no developed nations with modest-sized public sectors.
Even Singapore and Hong Kong have governments that consume about 20 percent of economic output.
But maybe if I someday achieve my goal, we’ll have better data.
And maybe some day I’ll go back to college and play quarterback for my beloved Georgia Bulldogs.
P.S. Since I shared one video, I can’t resist also including this snippet featuring Ronald Reagan talking about libertarianism.
What impresses me most about this clip is not that Reagan endorses libertarianism.
Instead, notice how he also explains the link between modern statism and fascism.
He had a much greater depth of knowledge than even supporters realize. Which also can be seen in this clip of Reagan explaining why the Keynesians were wrong about a return to Depression after World War II.
And click here if you simply want to enjoy some classic Reagan clips. For what it’s worth, this clip from his first inauguration is my favorite.
Given my man crush on the Gipper, you also won’t be surprised to learn that this is the most encouraging poll I’ve ever seen.
[mybooktable book=”global-tax-revolution-the-rise-of-tax-competition-and-the-battle-to-defend-it” display=”summary”]


The Arthurian / March 8, 2015
How does the Rahn Curve square with the long period of very rapid growth in China? I looked one time for data on the size of government in China but found none. I imagine their government is a shrinking share of GDP, yet still very large. Perhaps you could fill in some blanks for me.
/