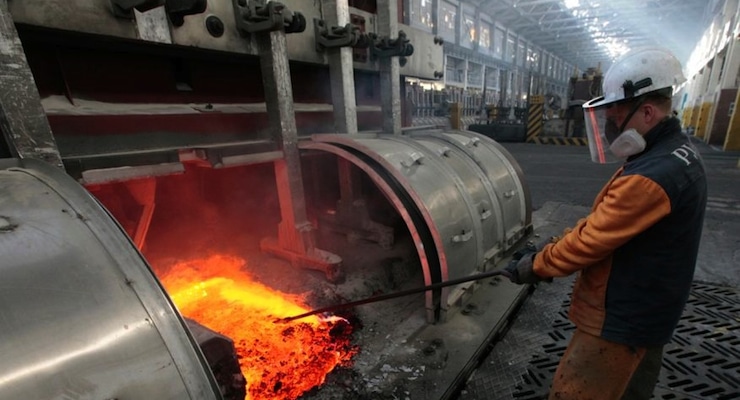

A worker in the mid-Atlantic manufacturing sector works with raw aluminum materials. (PHOTO: REUTERS)
The Manufacturing Business Outlook Survey, the Philadelphia Federal Reserve’s gauge of factory activity in the Mid-Atlantic region, increased to 21.5 in December. That’s up from a reading of 7.6 the month prior and significantly higher than the median forecast calling for a reading of 9.
A reading above zero indicates expansion, while those below indicate contraction.
As was the cast with the Empire State Manufacturing Survey released earlier today, manufacturers are far more optimistic about the future than they are about current conditions, particularly the next six months. Nearly 58% of the firms anticipate gains in manufacturing activity over the next six months, compared with 36% last month.
Special Question (December 2016)
|
Energy
(%) |
Other Raw Materials
(%) |
Intermediate Goods
(%) |
Wages
(%) |
Health Benefits
(%) |
Nonhealth Benefits
(%) |
Wages & Health Benefits & Nonhealth Benefits
(%) |
|
|---|---|---|---|---|---|---|---|
| Decline of more than 4% | 5.0 | 0.0 | 0.0 | 0.0 | 0.0 | 0.0 | 0.0 |
| Decline of 3-4% | 0.0 | 0.0 | 0.0 | 0.0 | 1.7 | 0.0 | 0.0 |
| Decline of 2-3% | 1.7 | 0.0 | 0.0 | 0.0 | 1.7 | 1.7 | 1.7 |
| Decline of 1-2% | 8.3 | 3.3 | 0.0 | 1.7 | 3.3 | 1.7 | 0.0 |
| No Change | 36.7 | 21.7 | 22.0 | 8.3 | 8.3 | 32.8 | 1.7 |
| Increase of 1-2% | 10.0 | 13.3 | 30.5 | 15.0 | 1.7 | 13.8 | 6.8 |
| Increase of 2-3% | 16.7 | 26.7 | 27.1 | 58.3 | 5.0 | 19.0 | 16.9 |
| Increase of 3-4% | 11.7 | 20.0 | 11.9 | 16.7 | 8.3 | 19.0 | 25.4 |
| Increase of 4-5% | 8.3 | 1.7 | 6.8 | 0.0 | 8.3 | 5.2 | 15.3 |
| Increase of 5-7.5% | 0.0 | 5.0 | 0.0 | 0.0 | 16.7 | 3.4 | 8.5 |
| Increase of 7.5-10% | 0.0 | 6.7 | 1.7 | 0.0 | 10.0 | 0.0 | 11.9 |
| Increase of 10-12.5% | 1.7 | 1.7 | 0.0 | 0.0 | 13.3 | 0.0 | 5.1 |
| Increase of 12.5-15% | 0.0 | 0.0 | 0.0 | 0.0 | 8.3 | 0.0 | 1.7 |
| Increase of 15-20% | 0.0 | 0.0 | 0.0 | 0.0 | 5.0 | 1.7 | 3.4 |
| Increase of more than 20% | 0.0 | 0.0 | 0.0 | 0.0 | 8.3 | 1.7 | 1.7 |
| Median | 0.0 | 2.5 | 1.5 | 2.5 | 6.3 | 2.0 | 3.5 |
| Average | 1.1 | 2.7 | 2.0 | 2.2 | 7.9 | 2.4 | 5.4 |


