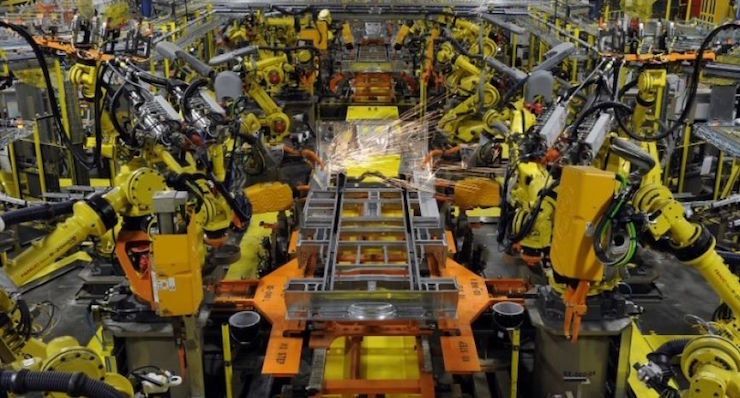

FILE PHOTO – Robotic arms spot welds on the chassis of a Ford Transit Van under assembly at the Ford Claycomo Assembly Plant in Claycomo, Missouri April 30, 2014. (Photo: REUTERS)
The Manufacturing Report On Business, the Institute for Supply Management gauge of national factory activity, came in slightly higher than the median forecast. The index, which has beaten the Econoday consensus for 7 months in a row by coming in at 57.2, comes as the first Manufacturers’ Outlook Survey since President Donald Trump took office shows a “dramatic shift in sentiment” to the highest level ever measured.
Of the 18 manufacturing industries, 17 reported growth in March and no industry reported contraction compared to February.
The National Association of Manufacturers (NAM) survey found more than 93% of manufacturers feeling positive about their economic outlook.
| MANUFACTURING AT A GLANCE March 2017 |
||||||
|---|---|---|---|---|---|---|
| Index | Series Index Mar |
Series Index Feb |
Percentage Point Change |
Direction | Rate of Change |
Trend* (Months) |
| PMI® | 57.2 | 57.7 | -0.5 | Growing | Slower | 7 |
| New Orders | 64.5 | 65.1 | -0.6 | Growing | Slower | 7 |
| Production | 57.6 | 62.9 | -5.3 | Growing | Slower | 7 |
| Employment | 58.9 | 54.2 | +4.7 | Growing | Faster | 6 |
| Supplier Deliveries | 55.9 | 54.8 | +1.1 | Slowing | Faster | 11 |
| Inventories | 49.0 | 51.5 | -2.5 | Contracting | From Growing |
1 |
| Customers’ Inventories | 47.0 | 47.5 | -0.5 | Too Low | Faster | 6 |
| Prices | 70.5 | 68.0 | +2.5 | Increasing | Faster | 13 |
| Backlog of Orders | 57.5 | 57.0 | +0.5 | Growing | Faster | 2 |
| New Export Orders | 59.0 | 55.0 | +4.0 | Growing | Faster | 13 |
| Imports | 53.5 | 54.0 | -0.5 | Growing | Slower | 2 |
| OVERALL ECONOMY | Growing | Slower | 94 | |||
| Manufacturing Sector | Growing | Slower | 7 | |||
Manufacturing ISM® Report On Business® data is seasonally adjusted for the New Orders, Production, Employment and Supplier Deliveries Indexes.
*Number of months moving in current direction.


