

IRS building, Internal Revenue Service HQ, Washington, D.C.
With tax day looming, let’s wallow in misery by contemplating the burden on America’s taxpayers.
But we’ll ignore the angst caused be dealing with an indecipherable tax code and an oppressive IRS and simply focus on the amount of money that gets extracted from our income each year.
The bad news is that the federal government is collecting a record amount of money, even after adjusting for inflation. Here’s a chart, based on the latest numbers from the Office of Management and Budget.
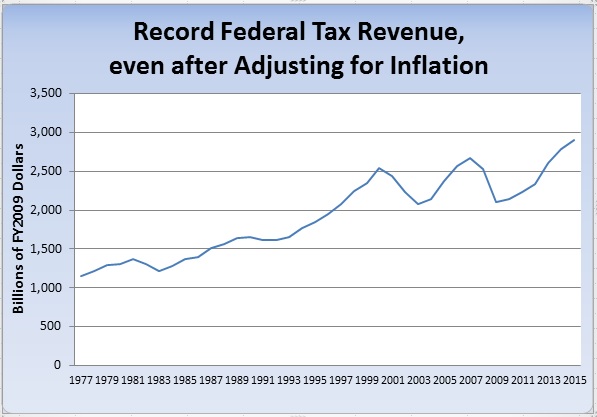
Source: Office of Management and Budget.
But there is some good news. This isn’t a record tax burden when measured as a share of economic output.
Federal taxes are projected to consume 17.7 percent of GDP this year. That’s higher than the post-WWII average of 17.2 percent of GDP, but there have been several years in which the federal tax burden has been higher than 17.7 percent, most recently in 2007, when it reached 17.9 percent of economic output.
So while it’s bad news that the IRS is collecting a record amount of revenue in inflation-adjusted dollars, I guess we should consider ourselves lucky that it’s not a record share of GDP.
I discuss the growing federal tax burden in this CNBC debate with Jared Bernstein.
A few points are worth emphasizing from the interview, two of which deal with corporate taxation.
First, it’s silly to talk to compare “taxes by individuals” to “taxes paid by corporations.” That’s because all taxes on business ultimately are paid by individuals, whether as workers, consumers, or shareholders. To be blunt, corporations may collect taxes, but the burden inevitably falls on people.
Second, the fact that corporate tax receipts are lagging is a sign that tax rates are too high rather than too low. In other words, there’s a Laffer Curve effect, and there’s lots of evidence that a lower corporate rate will generate more revenue. Which is precisely what happened when personal tax rates were reduced on the “rich” in the 1980s.
Third, if we want a balanced budget, the only responsible approach is spending restraint. As I’ve noted before, our long-run fiscal challenge is because of a rising burden of spending. Indeed, spending is more than 100 percent of the long-run problem.
By the way, let’s not forget about the role of state and local governments. WalletHub just released a report on state and local tax burdens.
Here are the 10 best states.
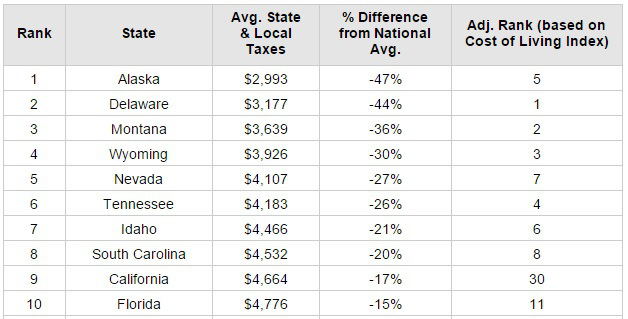
10 Best States For Federal & State Tax Burdens (Source: WalletHub)
I’m mystified to see California in the top 10.
Though maybe this is a Laffer Curve-based result. In other words, perhaps taxes are so high that people are paying less?
Moreover, the Golden State drops to 30 if you adjust for the cost of living (see column on far right).
Now here are the 10 worst states.
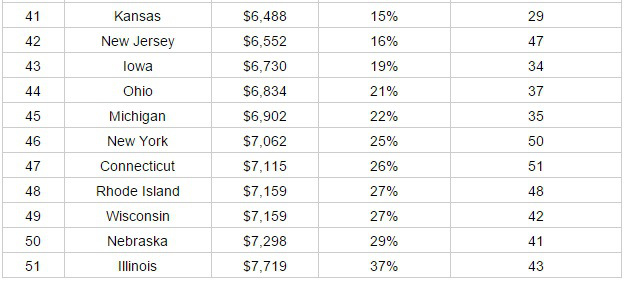
10 Worst States For Federal & State Tax Burdens (Source: WalletHub)
I’m not surprised to see Illinois in last place, but who knew that Nebraska was a hotbed of taxaholism?
And if you look at the right-most column, you’ll see that New York and Connecticut could be considered the worst states. Both jurisdictions are richly deserving of that designation.
P.S. Don’t forget that Puerto Rico is a secret tax haven for American citizens, particularly when considering federal taxes, so it deserves honorary first place recognition.
P.P.S. The best (i.e., least worst or least destructive) approach to taxation is the flat tax.
P.P.P.S. Though the ideal scenario is to have a very small federal government so that there’s no need for any broad-based tax whatsoever. Our nation enjoyed strong growth before that dark day in 1913 when the income tax was imposed.


Hypochondriac / April 11, 2015
How can you write an article about an increasing tax revenue and not even mention the word “population growth?” News flash: revenue not equal to tax burden.
/
Richard Baris / April 11, 2015
Hypochondriac, that’s why we have labor force participation rates and employment-to-population ratios. Since they are at 36- and 30-year lows, your premise that increased revenues reflects population growth is simply inaccurate. Fewer people are paying into the revenue stream now juxtaposed to 2009, thus, we should expect to see lower revenues all things being equal. If the labor force was the same now as it was in 2008-2009, then headline unemployment would be 10.9, real unemployment would be 15.5, and revenues would be far higher than they are now.
/
Hypochondriac / April 11, 2015
You’ve said a few things here which confuse the issue. First off, the labor participation rate is not a 1 for 1 with taxpayers. A number of groups not included in the Labor Participation Rate still pay taxes. This includes but is not limited to: Retired people receiving a pension, withdrawing from a 401k or traditional IRA, people who are wealthy and choose not to work, possibly people who are considered “management”.
“Fewer people are paying into the revenue stream now”
You mention fewer people paying in now compared with 2009 (which you base on the labor participation rate). That cannot be based on the labor participation rate, due to population growth. The population of the United States grew from 2008 to 2015, which means that even if the percentage of people working goes down, the total number can still go up. I don’t have any data to prove this is the case, I’m just saying that your explanation doesn’t make any sense in regards to my comment.
The chart prominently displayed in the article starts in the 70s and shows an
upward graph of government revenue in dollar amounts. This is the linchpin of the article. Are you telling me that the population hasn’t grown since the 70s? The fact that the author doesn’t mention population growth shows that this article is deliberately misinforming the reader. Cato Institute, enough said.
/
Richard Baris / April 16, 2015
Hypo,
You’ve actually made some decent points worth considering, and perhaps, I didn’t explain it in full (time constraints). But, the bottom line is: The tax base has substantially declined over the last several decades. No serious economist, save for Paul Krugman, but again, I said serious economist, would argue with that. All things being equal, we should have smaller revenues considering all data.
/
Scott Sonderly / April 13, 2015
Folks keep claiming that ‘the 47%’ don’t pay taxes. Well anyone with an above-the-table job pays SSI and FICA taxes which amount together to 15% of income. The irony about this is that the person who coined the term ‘47%’ himself (Romney) didn’t pay more than 15% because his assets were purportedly secreted in the Grand Cayman Islands. So much for fairness.
About the 15% the ‘47%’ pay – these funds go into the federal pot, most are spent immediately, thus making social security a kind of Ponzi scheme, dependent on young people paying monies back to the government to recoup the IOU’s the govt has written the system.
/