
President Donald J. Trump, left, shakes hands with House Speaker Paul Ryan, R-Wis., during Inauguration Day on January 20, 2017.
I was recently interviewed on Fox Business Network about Trump’s policies and the economy, and the discussion jumped around from issues such as border-adjustable taxation to energy regulation.
Though the central theme of the discussion was whether Trump had good ideas for American jobs and business competitiveness.
Given my schizophrenic views on Trump, this meant I was both supportive and critical, and I hope certain people in the White House paid attention to my comment about there being no need for the “stick” of protectionism if Trump delivers on the “carrot” of tax cuts and deregulation.
For today, though, I want to elaborate on why protectionism is the wrong approach. I mentioned in the interview that the long-run outlook for manufacturing employment wasn’t very good, but that we shouldn’t blame trade. So I decided to find a chart that illustrated this point, which then gave me the idea of using a Q&A format to share several charts and tables that make very strong points about trade and protectionism.
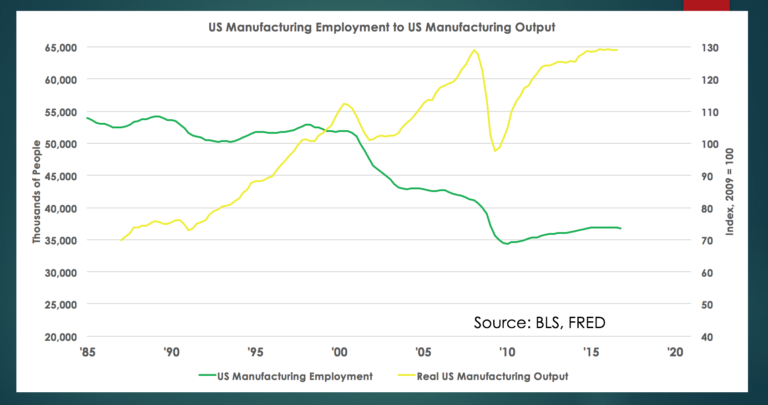
Did you know…that manufacturing employment is falling because of productivity growth rather than trade?
The bad news (at least for certain workers) is that manufacturing employment has fallen. And it will continue to fall. But as illustrated by this chart from Professor Don Boudreaux, manufacturing output is at record highs. What’s really happening is that productivity improvements enable more to be produced while using fewer workers. And this is happening all over the world.
Did you know…that there’s a strong relationship between trade openness and national prosperity?
One of Professor Boudreaux’s students augmented one of his charts to show the link between pro-trade policies and per-capita economic output.

Did you know…that you can’t hurt importers without also hurting exporters?
Many of the major multinational firms engage in considerable cross-border trade, meaning that they are both major importers and major exporters. Here’s a very illuminating chart from the Peterson Institute of International Economics.

Did you know…that protectionism imposes enormous losses on consumers and therefore is a net job destroyer?
There has been considerable research on the results of various protectionist policies and the results shared by Mark Perry of the American Enterprise Instituteinevitably show substantial economic costs, which means that the jobs that are saved (the “seen“) are more than offset by the jobs that are lost or never created (the “unseen“).

Last but not least, did you know….that economists are nearly unanimous in their recognition that trade barriers undermine prosperity?
There are plenty of jokes (many well deserved!) about economists, including the stereotype that economists can’t agree on anything. But there’s near-unanimity in the profession that protectionism is misguided.

By the way, if you have protectionist friends, ask them if they have good answer for these eight questions. And also direct them to the wise words of Walter Williams.
P.S. I wrote a few weeks ago about former President Obama’s dismal legacy. I then augmented that analysis with a more recent postscript citing Ramesh Ponnuru’s observation that Obama failed in his effort to be the left’s Reagan. Now it’s time for another worthy postscript. The Wall Street Journal reviewed the new numbers for growth in 2016 and opined on what this means for Obama’s overall record.
…growth for all of 2016 clocked in at 1.6%, the slowest since 2011 and down from 2.6% in 2015. That marks the 11th consecutive year that GDP growth failed to reach 3%, the longest period since the Bureau of Economic Analysis began reporting the figure. The fourth quarter also rings out the Obama era with an average annual growth rate of 1.8%, which is right down there with George W. Bush for the lowest among modern Presidents. Mr. Obama inherited a deep recession, but that makes the 2.1% growth average since the recession ended all the more dismaying. You have to work hard to suppress growth after a deep downturn, and Mr. Obama did that by putting income redistribution ahead of growth as a policy priority.
Amen. When you fixate on how the pie is sliced, you wind up with policies that cause the pie to be smaller.
[social-media-buttons]