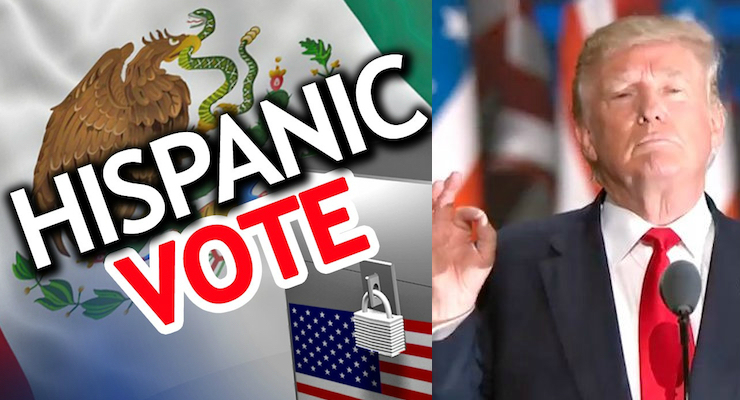

Donald Trump, right, speaks to the Republican National Convention in Cleveland, Ohio.
Armed with polling data, I’ve repeatedly argued against the idea that Republicans perform poorly among Hispanics due to immigration. Now, armed with more polling data, I’d like to expand on that argument to address the idea that Hispanic voters are “natural conservatives” and are more likely to vote Republican if the party “moderates” their position on immigration.
Unpacking the motives of Hispanic voters is far more complicated than talking heads would have us believe.
President George W. Bush, who is often incorrectly cited as winning 44% of the Hispanic vote (more like 40%), didn’t enjoy that support because he was open to open borders and expanding guest workers. The truth is that President Bush was a big government Republican and, at least on economic and government-run social programs, Hispanics are more liberal than Republicans want to admit.
And it’s even worse if we just look at party identification.
Only about one-fifth (22%) of Hispanics consider themselves Republican, while roughly a third (35%) say they are “strong” Democrats. Of the major ethnic voting blocs, Hispanics are among the most likely to consider themselves independent (44%). However, among these voters, Democrats have an edge (46% to 34%) when asked “do you think of yourself as more similar to Republicans than Democrats, more similar to Democrats than Republicans, or equally similar to Republicans and Democrats?”
On ideology, admittedly, the picture is more rosier for Republicans. But nevertheless Democrats have an edge, a substantial edge. Roughly 15% of Hispanics consider themselves “very liberal”; 30% consider themselves “moderately liberal”; and, 6% consider themselves “slightly liberal.” On the flip side, 13% consider themselves to be “extremely conservative”; 17% say “moderately conservative”; and, 4% consider themselves “slightly conservative.”
In total, the percentage of Hispanic voters who identify as “liberal” is 51%, or far above the national average, which is a little more than a fifth (22%), while those who identify as “conservative” is 34%, below the national average (38%).
Most Hispanic voters–as is the case with most other U.S. voting blocs–vote on the basis of class. The data support the theory most voters make a “rational policy choice” when they go to the ballot box and does not support the theory supporting looser immigration policy will make the party more attractive to Hispanic voters.
Indeed, the overall data indicate they would have more success with Hispanic voters if they framed immigration as an economic issue, focusing specifically on the impact on wages. PPD Polls aren’t the only surveys hinting at this, either. A Gallup poll found roughly 40% of U.S.-born Hispanics opposed President Obama’s unilateral action on DACA, a finding many at the time criticized.
Not convinced? Then why is Donald Trump, who most agree has been the most outspoken candidate against illegal immigration, polling ahead of Mitt Romney and John McCain among Hispanic voters?
In the People’s Pundit Daily U.S. Presidential Election Daily Tracking Poll, Mr. Trump’s 7-day average support among Hispanic voters has ranged from the high 20s to high 30s (7-day average), with the three-day average in July immediately after the convention hitting as high as 41%. Even on his lowest days, Mr. Trump has still enjoyed the support of more Hispanic voters than either of the two prior Republican nominees, one of whom was totally in favor of an amnesty-esque immigration reform bill.
According to the U.S. Census Bureau, the median household income for Hispanics in 2013 was $40,963, while the median household income for non-Hispanic whites was $58,270. Not surprisingly, Hispanic voters who have an annual income of $19,000 to $49,000 are more likely to support Mr. Trump than those making $50,000 or more.
Of course, there will always be those who are impacted by the media narrative and believe Republicans are anti-Hispanic immigrants. As is the case with any large-scale messaging movement, there are always successes. But on the whole, the outreach work the Republican Party has to do with the Hispanic community shouldn’t minimized with oversimplified explanations and even more simple one-size fits all policy proposals.
For one, it won’t work. But more importantly, it denigrates them as voters. If the Republican Party believes they have better solutions to the problems that plague Hispanic working men and women, then they should get to work reaching out to them with a convincing message to combat the opposing liberal ideology.
The above results are taken from a subset of 412 Hispanic voters interviewed from August 1 to August 3, 2016, during poll tracking for the People’s Pundit Daily U.S. Presidential Election Daily Tracking Poll.


