

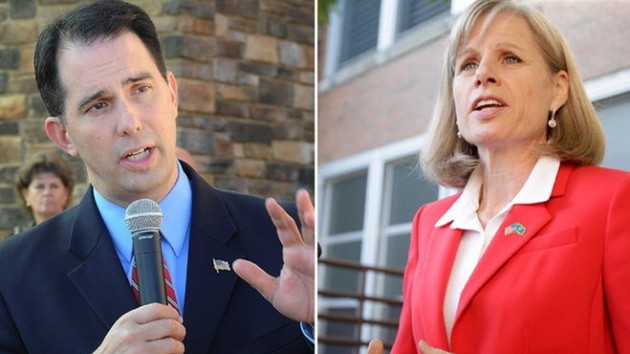
Incumbent Republican Gov. Scott Walker (left) is likely to defeat Democrat Mary Burke, according to the election projection model used by PPD.
The final Marquette Law School Poll found incumbent Republican Gov. Scott Walker leading Democrat Mary Burke among likely voters 50 – 43 percent in the Wisconsin governor race. While PPD’s election projection model is not easily moved by polls, we believe momentum is clearly moving in Gov. Walker’s favor. PPD’s anticipated final rating change for the race is from Leans Republican to Likely Republican.
Let’s take a look at the commentary, analysis, polling and state data. Of course, you can always get an idea of the overall political landscape by checking out the 2014 Governor Map and generic ballot tabs on the end.
[tabs id=”WIGov” title=”Wisconsin Governor Race – Walker (R) Vs. Burke (D)”] [tab title=”Commentary”]
Even among registered voters in the poll, which is a far more favorable gauge for Democratic candidates and frankly unrealistic at this point, Walker leads with 46 percent to Burke’s 45 percent, with 4 percent undecided and 1 percent saying that they will vote for someone else. However, Gov. Walker’s support was understated during the recall election by some of the very same pollsters claiming a tight race now — see here and here — with those two particular polls understating his support by an average of approximately 4 points.
According to PPD’s Pollster Scorecard, the Marquette Law School Poll is the highest rated pollster regarding contests in Wisconsin and, with only 3 percent saying that they are undecided or that they do not know whom they will support, the electorate appears to have little room for change less than a week to go before the votes are counted.
“Shifting turnout intentions have provided most of the dynamics of the race this fall,” said Marquette Law School Poll director Charles Franklin. “While the results among all registered voters have varied between a tie and a 3-point Walker edge, the likely-voter results have ranged from a 2-point Burke advantage to the current 7-point Walker lead.”
Before we break down each candidates support by party, unaffiliated voters, and so on, let’s first look at some numbers that speak volumes about the likely outcome of the race.
Burke’s favorability rating among likely voters is now underwater, 39 – 49 percent, while Wisconsin voters give Walker a slightly positive 48 – 47 percent. Among registered voters, 49 percent approve of the way Walker is handling his job as governor and 47 percent disapprove. Among likely voters, however, the results are far more favorable to the governor. A 52-percent majority approves and 46 percent disapproves, far above the 47 – 48 percent threshold needed for an incumbent to feel secure in reelection. Two weeks ago, 48 percent approved and 49 percent disapproved among registered voters, while among likely voters 50 percent approved and 48 percent disapproved.
Among registered voters, 51 percent say the state is headed in the right direction and less — 44 percent — say it is off on the wrong track. The optimism is even greater among likely voters, with 54 percent saying the state under Walker is headed in the right direction and 42 percent disagreeing.
Independents in the registered voter sample support Walker by a wide 46 – 40 percent margin over Burke, while independent likely voters support Walker over Burke by a wider 52 – 37 percent. In addition to winning critical independents, Gov. Walker appears to have solidified his base to a greater degree than Burke, as 92 percent of registered Republicans back their candidate compared to 88 percent of registered Democrats. Curiously, among likely voters the margin tightens, with 94 percent of Republicans supporting Walker and 93 percent of Democrats supporting Burke.
The poll interviewed 1,409 registered voters, including 1,164 likely voters, by landline and cell phone Oct. 23-26. For the full sample of 1,409 registered voters, the margin of error is +/- 2.7 percentage points. The margin of error for the sample of 1,164 likely voters is +/- 3.0 percentage points. This is the final Marquette Law School Poll before the Nov. 4 election.
[/tab][tab title=”Analysis”]
Walker’s coalition appears to mirror the coalition he put together in 2010 and again during the 2012 recall election, when a group of Walker-Obama voters played an intricate role in the election. According to exit polling from the recall election and the 2012 presidential election, Walker-Obama voters — or, voters who supported Scott Walker in his recall victory and Barack Obama in the 2012 presidential election — represented approximately 6 percent of the recent Wisconsin electorate.
Worth noting, that is nearly identical to the margin that allowed President Obama to carry the state against Mitt Romney in 2012.
The Republican enthusiasm gap waned last month, which we suspect accounts for the perceived tightening of the race. However, according to the new numbers, it has now returned. In the latest poll, 93 percent of Republicans say that they are certain to vote, while 82 percent of Democrats and 75 percent of independents say the same.
For all the talk about the superiority of the Democratic Party’s ground game, there is a serious factor rarely discussed by political prognosticators. There is truly something to be said about the Republican ground game in Wisconsin during midterm elections, a disparity recently highlighted by RNC Chairman Reince Priebus that even Wisconsin Democrats don’t disagree exists. They do, however, contend just how much they feel they have closed the gap. The problem with the argument is that Walker-Obama voters would have elected Gov. Scott Walker in electorates that look like 2010 and 2012, limiting just how much ground they could make up on a solid crossover candidate like Gov. Walker.
In 2014, the Partisan Voting Index is estimated at a barely Democratic D+2, a particularly noteworthy measurement. In 2010, Republican candidates running in states where the PVI was D+2 or more Republican had an 83 percent success rate. Considering the proven strength of Gov. Scott Walker as a candidate, as well as all other data previously considered, it isn’t too surprising the Wisconsin Governor race is now rated Likely Republican by PPD’s 2014 Governor Map Predictions model.
Gov. Walker now enjoys a 77 percent chance of success. We, like others, believe that Walker was emboldened by his 2012 recall victory, and if reelected as we believe he is more “likely” than not to be, Walker would be a strong potential dark horse in the 2016 presidential nomination.
[/tab]
[tab title=”Polls”]
| Poll | Date | Sample | MoE | Walker (R) | Burke (D) | Raw Spread | PPD Spread |
|---|---|---|---|---|---|---|---|
| PPD Average | 10/16 – 10/26 | — | — | 47.8 | 45.8 | Walker +2.0 | Walker +4.5 |
| Marquette University | 10/23 – 10/26 | 1164 LV | 3.0 | 50 | 43 | Walker +7 | |
| CBS News/NYT/YouGov | 10/16 – 10/23 | 3308 LV | 3.0 | 46 | 45 | Walker +1 | |
| Rasmussen Reports | 10/20 – 10/21 | 973 LV | 3.0 | 48 | 49 | Burke +1 | |
| WPR/St. Norbert | 10/18 – 10/21 | 525 LV | 4.4 | 47 | 46 | Walker +1 | |
| Marquette University | 10/9 – 10/12 | 803 LV | 3.5 | 47 | 47 | Tie | |
| CBS News/NYT/YouGov | 9/20 – 10/1 | 1444 LV | 3.0 | 48 | 49 | Burke +1 | |
| Marquette University | 9/25 – 9/28 | 585 LV | 4.1 | 50 | 45 | Walker +5 | |
| Marquette University | 9/11 – 9/14 | 589 LV | 4.1 | 49 | 46 | Walker +3 | |
| Rasmussen Reports | 9/15 – 9/16 | 750 LV | 4.0 | 48 | 46 | Walker +2 | |
| WeAskAmerica* | 9/3 – 9/3 | 1170 LV | 3.0 | 44 | 48 | Burke +4 | |
| CBS News/NYT/YouGov | 8/18 – 9/2 | 1473 LV | 4.0 | 49 | 45 | Walker +4 | |
| Marquette University | 8/21 – 8/24 | 609 LV | 4.1 | 47 | 49 | Burke +2 | |
| Rasmussen Reports | 8/13 – 8/14 | 750 LV | 4.0 | 48 | 47 | Walker +1 | |
| Marquette University | 7/17 – 7/20 | 549 LV | 4.3 | 46 | 47 | Burke +1 | |
| CBS News/NYT/YouGov | 7/5 – 7/24 | 1968 RV | — | 47 | 46 | Walker +1 | |
| Marquette University | 5/15 – 5/18 | 586 LV | 3.5 | 48 | 45 | Walker +3 | |
| Magellan Strategies (R) | 4/14 – 4/15 | 851 LV | 3.4 | 47 | 47 | Tie | |
| PPP (D) | 4/17 – 4/20 | 1144 RV | 2.9 | 48 | 45 | Walker +3 | |
| WPR/St. Norbert | 3/24 – 4/3 | LV | — | 56 | 40 | Walker +16 | |
| Marquette University | 3/20 – 3/23 | 801 RV | 3.5 | 48 | 41 | Walker +7 | |
| Rasmussen Reports | 3/10 – 3/11 | 500 LV | 4.5 | 45 | 45 | Tie | |
| Marquette University | 1/20 – 1/23 | 802 RV | 3.5 | 47 | 41 | Walker +6 | |
| Marquette University | 10/21 – 10/24 | 800 RV | 3.5 | 47 | 45 | Walker +2 | |
| PPP (D) | 9/13 – 9/16 | 1180 RV | 2.9 | 48 | 42 | Walker +6 |
(Please note: Our model uses separately calculated averages from weighted polls based on PPD’s Pollster Scorecard. Above is the raw spread and average.)[/tab]
[tab title=”State Data”]
POLITICS |
Wisconsin | National Average |
Partisanship |
||
| % Republican/Lean Republican | 41 | 39 |
| % Democratic/Lean Democratic | 43 | 43 |
| Registered Republicans | Wisconsin does not register voters by party preference or affiliation. | — |
| Registered Democrats | Wisconsin does not register voters by party preference or affiliation. | — |
| Unaffiliated/Undeclared | Wisconsin does not register voters by party preference or affiliation. | — |
Ideology |
||
| % Conservative | 37 | 36 |
| % Moderate | 37 | 36 |
| % Liberal | 21 | 23 |
Presidential Job Approval |
||
| % Approve | 43 | 41 |
Partisan Voting Index |
||
| Barely Democratic | D+2 | — |
[/tab]
[tab title=”2014 Governor Map”]
[show-map id=’2′]
LEGEND: SAFE DEM | LIKELY DEM | LEANS DEM | TOSS-UP | LEANS GOP | LIKELY GOP | SAFE GOP
[/tab]
[tab title=”Generic Ballot”]
[table id=3 /]
[/tab]
[/tabs]


j7apple / November 2, 2014
Its a shame the Dems had nothing better to off up than Burke for the Gov race. This is a seat that could have swung Dem .
/
Richard Baris / November 2, 2014
I agree with that. A stronger Democratic candidate could’ve made this race more competitive.
/