
People count money at Macy’s Herald Square store during the early opening of the Black Friday sales in the Manhattan borough of New York, November 26, 2015. (Photo: Reuters)
Let’s consider some good news about America. Some folks on the left like to claim that the middle class is shrinking and that therefore we need bigger government and more redistribution to protect these Americans from falling into poverty.
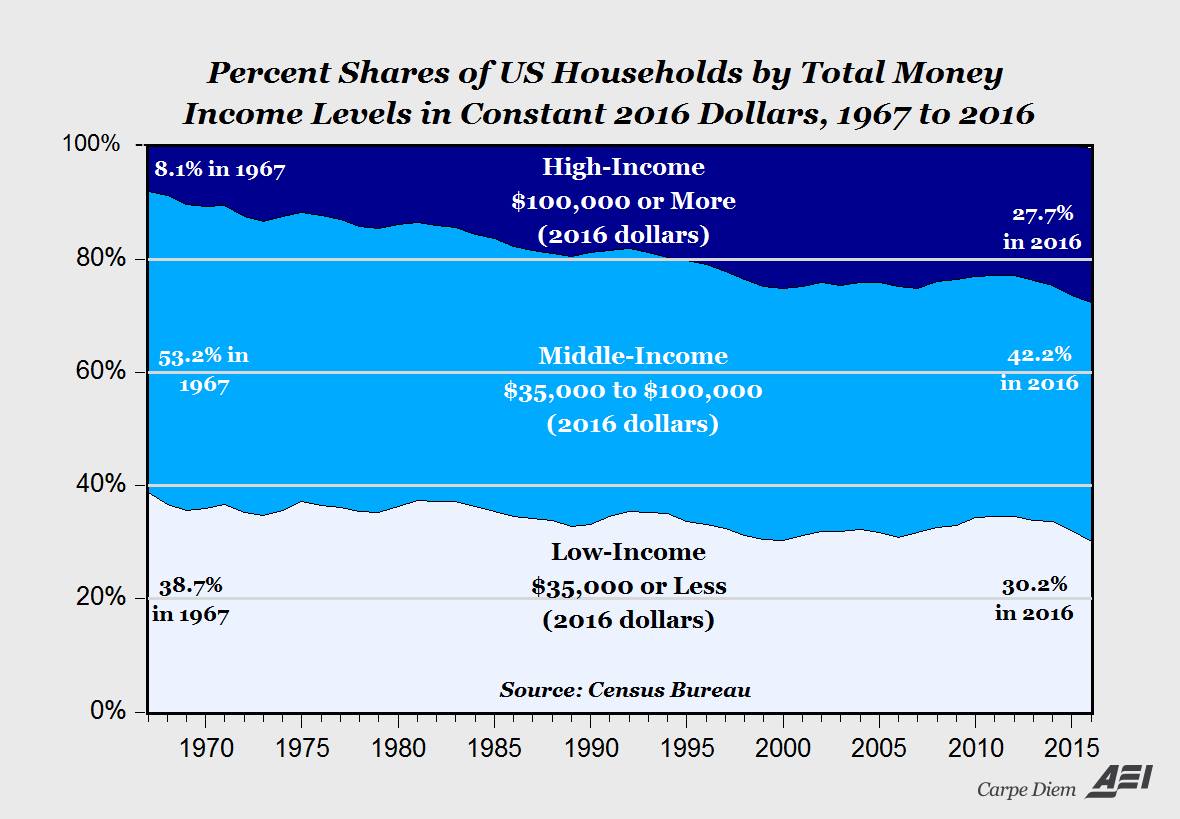
Well, the first half of that statement is true. The middle class is becoming smaller. But here’s the good news. As I noted in 2015 when sharing some data from Pew, the middle class is shrinking because more and more households are earning six-figure incomes.
Now we have more confirmation. Courtesy of Mark Perry of the American Enterprise Institute, here’s a nice chart based on data from the Census Bureau’s new report on income and poverty in the United States.
Want to feel even better?
In a column for CNBC, Professor Daniel Smith of Troy University explains that government data understates the improvements in living standards. He points out that total compensation has increased much faster than wages.
Complaints that the rich are getting richer while the majority have hit a brick wall in wage growth have led to calls to impose regulations and taxes aimed at creating a “fair” economy. This mantra, however, is wrought with holes and erroneous interpretation of the data…
Over the last few decades, employees have been receiving an increasingly larger portion of their overall compensation in the form of benefits such as health care, paid vacation time, hour flexibility, improved work environments and even daycare. …Total compensation, which adds these benefits to wages and salaries, shows that earnings have actually increased more than 45 percent since 1964.
And he notes that income gains are understated if measured against the PCE index rather than the consumer price index.
Furthermore, “purchasing power,” the amount of stuff people can buy with each dollar, has changed dramatically… CPI is notorious for overstating inflation, and thus understating the growth of real wages received by workers. Adjusting the data with the more appropriate Personal Consumption Expenditure index brings the growth in average hourly wages from 5.58 percent to more than 35 percent and the growth in total compensation of employees from more than 45 percent to more than 87 percent.
The bottom line is we’re able to buy more and better for less work.
But even that index fails to grasp the drastic increase in what workers get for their wages. …100.5 hours of work was required to purchase a washing machine in 1959 compared to just 23.3 hours of work (for the average worker) in 2013. Purchasing a TV demanded an astounding 127.8 hours of work in 1959, whereas a worker in 2013 could purchase one with only 20.7 hours of work. Moreover, the improved quality of these goods over the past few decades is staggering. …Today’s iPhones and other smart-phone models seem like a different species from their predecessors… We’ve seen the same progress in knee-replacement surgeries, computers, the Internet, vacuum cleaners, and other technologies we’ve come to rely on.
Professor Smith wrote this piece back in 2014, but these arguments apply just as well today as they did back then.
Though I don’t want to be a Pollyanna. There are very worrisome trends in our economy, especially increased dependency and reduced labor force participation.
So if you prefer to look at the glass as being half empty, Nicholas Eberstadt of the American University authored an article that is very pessimistic assessment about recent trends.
It turns out that the year 2000 marks a grim historical milestone of sorts for our nation. For whatever reasons, the Great American Escalator, which had lifted successive generations of Americans to ever higher standards of living and levels of social well-being, broke down around then—and broke down very badly.
…it should be painfully obvious that the U.S. economy has been in the grip of deep dysfunction since the dawn of the new century. …It took America six and a half years—until mid-2014—to get back to its late 2007 per capita production levels. And in late 2016, per capita output was just 4 percent higher than in late 2007—nine years earlier. By this reckoning, the American economy looks to have suffered something close to a lost decade. …Between 2000 and 2016, per capita growth in America has averaged less than 1 percent a year. To state it plainly: With postwar, pre-21st-century rates for the years 2000–2016, per capita GDP in America would be more than 20 percent higher than it is today. …If 21st-century America’s GDP trends have been disappointing, labor-force trends have been utterly dismal. Work rates have fallen off a cliff since the year 2000 and are at their lowest levels in decades.
I don’t disagree with any of this. Growth has been weak this century.
Which is hardly a surprise since we’ve seen an erosion of economic liberty (thanks Bush and Obama!).
But I also want to keep things in perspective. Weak growth is better than no growth. Our living standards are increasing, even if they could – and should – be rising at a faster clip.
So let me swing back to the Pollyanna side by sharing a chart which ostensibly is bad news because it shows rising inequality. But I view it as good news because it shows that all of us are at least 40 percent richer – in real terms – than we were back around 1980.

By the way, Thomas Sowell has pointed out that higher-income households tend to do better because they have more people working, while lower-income households feature lots of dependency. Moreover, if Professor Smith and others are right, the increase in living standards is far greater than what this chart shows anyhow. But even if you accept this data at face value, we are all getting richer over time.
Yes, growth rates should be faster and incomes should be climbing more rapidly. Especially at the bottom. Whether you look at global data or country-specific data, that’s an argument for free markets and small government.
As I wrote last year, we don’t need perfect policy to get more prosperity. Just give the private sector some breathing room.