

When I give speeches on fiscal policy, I commonly get some variation of this question (and you can choose one of more of the options).
Isn’t our fiscal problem largely the result of the wars/intervention/Iraq/Afghanistan/Libya/Syria launched by Bush/Hillary/neocons/Blackwater/Pentagon?
I generally respond by first confessing my lack of expertise on military and foreign affairs, but then I point out that I’m not a fan of nation building (see George Will and Mark Steyn on this topic), so I tell people that I’m very sympathetic to the proposition that trillions of dollars that have been misspent on foreign adventurism this century. Not to mention the human cost of dead and wounded American soldiers.
But I then tell audiences that the Pentagon is not the reason why we’re in fiscal trouble.
Let’s look at two charts, both derived from the Office and Management and Budget’s historical data.
First, here are two pie charts based on the spreadsheet in Table 4.2, which looks at how much of the budget is consumed by different agencies and departments. For both 1962 and 2016, I added together outlays for the Department of Defense and Department of Veterans Affairs and compared that military-related spending to other major categories.
As you can see, military-related outlays used to account for more than one-half of the federal budget, but not they are less than one-fourth of total spending in Washington.
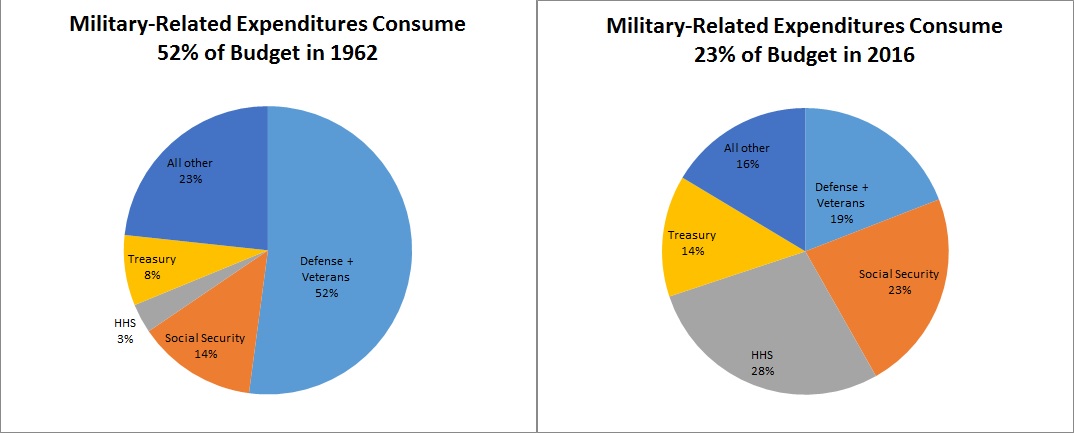
Notice, by the way, that Social Security spending now consumes a significantly larger share of the federal budget, as does spending by the Treasury Department (I assume much of that is EITC redistribution).
But the biggest change, by far, is that the Department of Health and Human Services used to account for 3 percent of federal outlays, but now eats up 28 percent of the budget. Why? Because of programs such as Medicare, Medicaid, and ObamaCare.
By the way, the above numbers do not mean that the military budget has been cut.
Here’s our second chart, which is based on the spreadsheet in Table 8.2, which has the numbers for inflation-adjusted outlays for major budget categories.
As you can see, the federal government is spending more today on defense than it was back in the 1960s, even after adjusting for inflation. And outlays for “domestic discretionary” programs also have increased.
But what’s obviously driving fiscal policy is the relentless expansion of entitlements (referred to as “mandatory spending” for purposes of the Budget Enforcement Act).
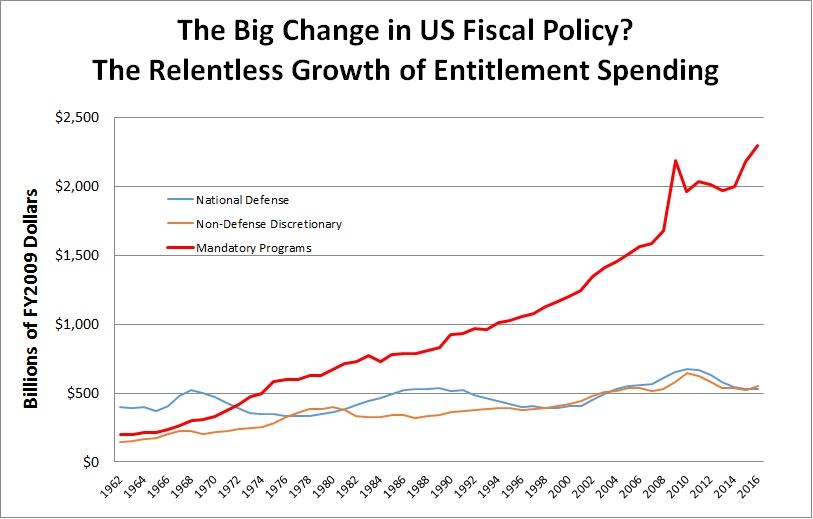
And because of demographic changes and bad policy choices, outlays for entitlement are projected to become a much larger burden in the future.
So now, perhaps, you understand why I keep arguing in favor of genuine entitlement reform and why I think it’s so critical that Donald Trump reconsider his skepticism.
P.S. In addition to George Will and Mark Steyn, Barack Obama also expressed some support for a libertarian-oriented foreign policy. But only in theory, not in practice.
P.P.S. To put America’s military spending in global context, check out this pie chart.


John Donohue / November 20, 2016
Who is to blame? We. This is a democracy, right? Whatever we or our representatives put into law, that is binding. The people have spoken. So, you are to blame. I am to blame. We.
Here’s another way of saying it: “The current Federal Government Debt, divided by the population, comes to $65,000. How are you, each of you, going to pay that back?” A family of four owes $250,000.
Here is the graph of spending for the Federal Government for 2014, the last year I did the workup from gov. stats. The ratios have not changed much.
http://jrdonohue.com/actual2014.jpg
We wanted to go from zero for social welfare 125 years ago, to 70% for social welfare now. We are to blame.
/
?)))CamoJackv2(((? / November 21, 2016
@PPDNews Diversity?
/