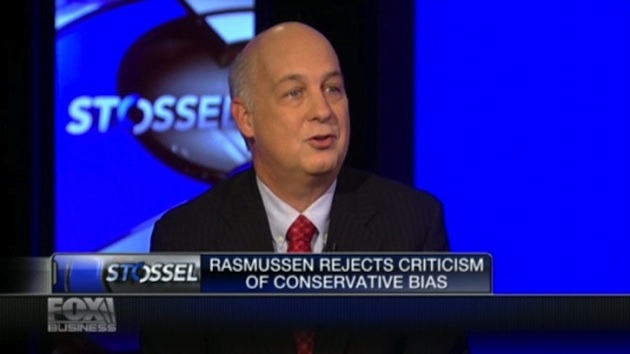
Scott Rasmussen, the former head of the Republican-leaning robo pollster, Rasmussen Reports.
After receiving a black eye for badly calling the 2012 president election, Scott Rasmussen, the former head of Rasmussen Reports, parted ways with the public opinion enterprise he founded in 2003. The firm said it was over “disagreements” in business strategy. Now that the 2014 elections are over, two things are crystal clear.
First, as our readers well-know, we have long-criticized the polling firm’s methodologies and results. Today, it is an indisputable fact that those criticisms were valid. Second, even though he was wrong in 2012, Scott Rasmussen was right to object to the firm’s overly ambitious retooling project. They grossly overestimated Democratic support and, thus, their chances of holding the U.S. Senate. It wasn’t just that they overestimated Democrat support, but how badly they underestimated Republican support.
Rasmusssen was certainly not the only pollster to strike out, but they are the only ones — so far — pretending they didn’t.
In a post-election defense of their results, the staff published an article entitled 2014 Midterm Elections: How Did We Do in the Senate Races?, in which they decided to defend the indefensible, rather than apologize to their subscribers, media and viewers. It is extremely doubtful that many of them were hoping to read plain-old delusional denial the following day.
“It’s interesting to note that in the races in which the spread was really off for us (and the Real Clear Politics average of all pollsters), most of the time we were spot-on for the Democratic number but wrong on the Republican number,” they wrote. “But if you add the percentage of voters ‘not sure’ to the GOP side, you will come very close to the final Republican number.”
Not only is this simply not true if we look at their polling data, but nowhere in the history of American politics will you find an election cycle where that many undecided voters broke that decidedly in one direction in one day. While it is certainly true that the overwhelming majority of undecided voters heavily backed the Republican candidate, in general, the wave that resulted didn’t build overnight.
“We had only three races as Toss-Ups going into Election Day – Georgia, Iowa and North Carolina,” they added. “Republicans in Georgia and Iowa outperformed our numbers and those of other pollsters, too. North Carolina was just as close as we projected.”
Let’s scrutinize some of their polls — and claims — shall we?
Rasmussen Georgia Senate Polls Vs. Results
| Georgia | David Perdue (R) | Michelle Nunn (D) | Some other candidate | Not sure |
| May 21-22, 2014 | 42% | 45% | 7% | 6% |
| July 23-24, 2014 | 46% | 40% | 4% | 10% |
| September 15-16, 2014 | 46% | 41% | 4% | 9% |
| Sep 30-Oct 1, 2014 | 46% | 42% | 3% | 9% |
| October 25-27, 2014 | 48% | 48% | 0% | 5% |
| Final Outcome | 53% | 45.1% | ||
| Final Spread | 7.8 | |||
| RCP Average* | 3.2 |
(Source: Rasmussen Reports, Georgia Secretary of State.)
So, not only did they badly underestimate Sen.-elect David Perdue’s margin by 5 points — actually, it was slightly more than that — but they overestimated Michelle Nunn’s support by 3.1 percent. Their results missed the margin, displaying a Democratic bias of least 8.1 percent. Perhaps defendable, if not for the pattern.
Rasmussen Iowa Senate Polls Vs. Results
| Iowa | Joni Ernst (R) | Bruce Braley (D) | Some Other Candidate | Not sure |
| June 4-6, 2014 | 45% | 44% | 3% | 9% |
| August 11-12, 2014 | 40% | 40% | 6% | 8% |
| September 17-18, 2014 | 43% | 43% | 4% | 10% |
| October 8-10, 2014 | 46% | 43% | 3% | 7% |
| October 28-30, 2014 | 48% | 47% | 3% | 3% |
| Final Outcome | 52.2% | 43.7% | ||
| Final Spread | 8.5 | |||
| RCP Average* | 1.4 |
(Source: Rasmussen Reports, Iowa Secretary of State.)
Indefensible. Again, they underestimated Sen.-elect Joni Ernst by approximately 4.2 percent, but overestimated Bruce Braley’s by 4.7 percent. That’s an even worse 8.9-point Democratic bias.
The same is true for other partisan robo pollsters, including Public Policy Polling. Until recently, we haven’t been willing to pull the trigger and blacklist either firm, barring them from holding any weight in PPD’s election projection model. Unlike other models, we are sifting through the data not for purposes of retooling, but to validate the model’s stellar results to our readers. PPD’s debut couldn’t have been more successful this year, as we were the single-most accurate model of the 2014 midterm election cycle.
Our success was a combination of weighing “big picture fundamentals” more heavily than unreliable polling that gyrated wildly back-and-forth, unlike other models, and PPD’s Pollster Scorecard. Using the Scorecard, PPD’s election projection model calculates what we call “pollster bias,” or what others like Nate Silver often to refer to as a House Effect. We will be dealing with Silver in more detail in the days ahead, but for now it is worth noting that his pollster ratings actually factored in a 2.3-point Republican bias for Rasmussen Reports, which adjusted the margin to show a Braley win for that particular survey.
Without giving away trade secrets to those in desperate need of a model makeover, we will just simply say that our model is superior because we are able to pick up on pollster miscalculations almost in real-time, rather than waiting to be shocked by election results, as Silver and his readers are now. Further, PPD tracking polls are weighed heavier because we use Gold Standard polling practices, and track respondents in highly reliable voter files.
With our Pollster Scorecard, inaccurate pollsters like Rasmussen Reports are statistically unable to exert undeserved influence on our probabilities and ratings. They certainly cannot claim that they didn’t have any data to suggest they needed a methodological reboot, as PPD’s Pollster Scorecard picked up on their heavily Democratic bias earlier than 2014.
Less than two weeks before the 2013 Virginia governor race, Rasmussen’s survey showed Democrat Terry McAuliffe leading Republican Ken Cuccinelli 50 – 33 percent, in a survey that supposedly had a margin of error of just 3 percent. PPP, too, found the Democrat a 13-point favorite in the race. Rasmussen’s final poll conducted just a few days later, which they conducted after receiving serious public and private pushback, showed the race tightening to 7 points, an unlikely swing in a notoriously un-swingy electorate. PPP, too, found the Democrat a 7-point favorite.
Cuccinelli did lose the race, but by just over 2 points.
Historically, even as the state has become more and more competitive, a Republican candidate’s floor of support is nowhere near the low 30s and, in fact, it isn’t at all in the 30s. A simple comparison of snap-shot and tracking surveys on presidential job approval, which we’ve previously examined, also displayed a serious Democratic bias.
Rasmussen Reports was in clear need of a retooling effort after the 2012 elections, but they over-corrected their model. Rather than learning from their mistakes to earn back their credibility, they are instead hoping media and voters are too stupid to notice. Considering the enormous influence pollsters have on voters’ perceptions in elections, they should also feel an equally enormous responsibility. It’s obvious that they do not grasp the gravity of that responsibility, and that’s an insult to the industry, worst still to the voters, and is just one more thing the American people find wrong with American politics.