


President Obama gives his sixth State of the Union speech on January 20, 2015. (Photo: AP)
What does World War I have to do with Obamanomics?
There’s no real connection, of course, but it did give me an opportunity to present a good analogy. At a conference in London last week, I was discussing with some folks the state of the American economy and the role of public policy.
I was trying to explain what’s happened in the past few years, describing the avalanche of bad policy last decade, culminating with the faux stimulus in 2009 and the enactment of ObamaCare in 2010.
I then said that Obama’s efforts to impose further statism have been largely stymied, particularly after the Tea Party election of 2010. There have been lots of skirmishes in recent years, to be sure, with Obama winning a few (such as the recent imposition of “net neutrality” regulations on the Internet) but also losing a few (such as spending restraint caused by policies like the sequester).
But the fact that Obama hasn’t been able to make additional “progress” is not really a victory. It’s simply a stalemate.
And that’s where the World War I analogy fits. As I was trying to get across my point, it occurred to me that it’s vaguely like World War I.
 When the war started, the Germans gained considerable ground, overrunning much of Belgium and a lot of territory in northwestern France. That’s akin to Obama’s victories in 2009-2010.
But then the period of trench warfare began and neither side made much progress. And that’s a good description of what’s been happening in recent years in Washington.
This is a good news-bad news situation. To continue with my analogy, the good news is that Obama isn’t conquering more territory. The bad news is that we aren’t pushing Obama back into Germany and reclaiming territory.
And so long as we’re in this stalemate, it’s unlikely that we’ll enjoy robust economic growth. And that’s our topic for today.
In my actual speech, I dusted off my charts based on Minneapolis Fed data, and updated them to compare today’s weak recovery with what’s happened during previous business cycles. And I specifically focused on a comparison of the very strong growth of the Reagan years with the lackluster growth of the Obama years.
But it’s a pity that my speech wasn’t one week later, because I’ve just seen some really good contributions on the same topic from economists Robert Higgs and John Taylor.
Writing for the Independent Institute, Higgs looks at what’s been happening with a key measure of our prosperity.
Arguably the best single, currently available measure of the entire public’s payoff from economic activity is real disposable income per capita. This is the average amount per annum that Americans receive in exchange for the use of their labor and other input services, after taxes, corrected for changes in the purchasing power of the dollar. …this measure of economic well-being has scarcely increased at all since 2007.
Higgs also prepared a table to make it easier to compare performance of this important variable during various business cycles.
As you can see, the current “recovery” has been dismal compared to previous periods.
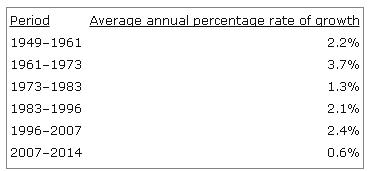
And here’s his analysis of why we’re suffering from sub-par growth.
These figures demonstrate that even though the rate of increase has varied substantially in the past, it has never remained so low as it has been in recent years. Even during the decade of so-called stagflation from the early 1970s to the early 1980s, real disposable income per capita grew more than twice as fast as it has grown in the past seven years. In the past, recessions were always followed by relatively brisk growth during the first several years of the ensuing recovery. Such has not been the case this time. Nor do forecasters anticipate any such surge of growth in the future. Might it be that the state’s burdens loaded onto the private producers of wealth—taxes, regulations, uncertainties, intrusions of all sorts, including demands for elaborate reports, asset seizures, and threats of felony prosecution for completely innocent and harmless actions—have finally become the “last straw” for these long-suffering camels? …the current situation is clear enough. The U.S. economy, though not yet completely stagnant, has made little headway for more than seven years, and there is little reason to foresee any great change in this regard.
Returning to my analogy, Higgs is basically saying that we’ll be mired in trench warfare for the foreseeable future.
Not exactly a rosy projection.
Now let’s look at the analysis of Professor John Taylor of Stanford University. He starts by walking through a timeline of the current “recovery.”
At the time of the first anniversary of current recovery in 2010, it showed clear signs of weakness compared to the recovery from the recessions in the early 1980s and from all other deep recessions in American history. …By the recovery’s second anniversary in 2011, it was weak for long enough that I called it “a recovery in name only, so weak as to be nonexistent.” …By the recovery’s third anniversary in 2012, it was now the worst recovery from a deep recession in American history. …By the recovery’s fourth anniversary in 2013, few disputed any more that it was unusually weak and disappointing. …By the recovery’s fifth anniversary, we were so far away from the recession that linking the terrible performance to the recession became increasing far-fetched.
Professor Taylor has a couple of charts of his own that bolster his argument.
Here’s a comparison of quarterly growth during the Obama recovery and Reagan recovery.
If you’re keeping score, Reagan’s economy out-performed Obama’s economy (often by a very wide margin) in 19 out of 22 quarters.

If this was a boxing match, it would have been stopped long ago.
Taylor also looks at the performance of the labor market during the Obama recovery and Reagan recovery.

Once again, there’s no comparison. During the Reagan years more people were working and adding to the productive capacity of the nation.
During the Obama years, by contrast, the most optimistic assessment is that we’re treading water.
Here’s more of his analysis about the ongoing stagnation.
With the recovery now approaching its sixth anniversary, there is more optimism that we are finally coming out the excruciating slow growth. There is also some wishful thinking that the drop of people out of the labor force—which has made the unemployment rate come down—is due to demographic factors not the slow growth itself. And we are not as bad as Europe. But as these charts show there is still not much in this recovery to write home about. Growth over the four quarters of 2014 looks to average only 2.2% compared with 4.4% in the corresponding quarters of the 1980s recovery. And as of January 2015 the employment-to-population ratio is still lower than at the start of the recovery.
So what’s the bottom line?
To be blunt, you can’t make America more like Europe and then be surprised that our economy isn’t firing on all cylinders.
Returning to our analogy, we need to defeat the enemy of statism and reclaim our lost territory.
But that won’t happen until 2017 at the earliest. And it’s possible it will never happen, particularly if we don’t implement genuine entitlement reform.
P.S. The bad news is that we’re becoming more like Europe. The good news is that we’re not there yet. Our overall burden of government has expanded, but we still have considerably more economic liberty than the average European nation. And that helps to explain why our recovery (even though anemic by American standards) is far more impressive than what’s been happening across the Atlantic.
P.P.S. Based on insightful analysis from Thomas Sowell, John Mackey, and Ronald Reagan, it may have been more accurate (albeit snarky and inappropriate) to have used a World War II example, with Obama’s first two years being akin to the Nazi blitzkrieg and the conquest of France, and recent years being akin to the period between the Battle of Britain and D-Day.


Westerncpl / February 28, 2015
Yet another right wing sleeze selling BULL(*@^% to STUPID people. You’re obviously at Cato because Hoover wouldn’t have you. Unlike Wilson, I’ll end this war with 7 points rather than 14:
1. The economic collapse of this country was caused by the insane politics of Bush and the string of scandal laden Republican House Speakers and YOU KNOW IT.
2. If you still have to cling to Laugher and his napkin, please explain the amazing economic success of Jindal and Brownback. It did not work under Reagan (oh please don’t push the Democrats STABBED HIM IN THE BACK BS – your WWI analogy is already full of *&^#) and it has not worked for these two clowns.
3. You damn well know that every recession in the 20th century ended with growth in the HOUSING and CONSTRUCTION sectors. Because of the insistence of republican politicians not to clean up the financial industry there was NO FINANCING for housing and construction. Where exactly was your chart for this? Oh that’s right, it doesn’t fit the false narrative you want to push. So you think you can pawn your crap off on people too lazy to call you on it.
4. Reagan pumped $2T in federal spending into the economy PLUS almost $1T in defense procurement programs boosting the manufacturing sector – and CALLED IT GROWTH. You prefer to now deride that as “Stimulus” and apparently lie about it.
5. In EVERY Republican lead state the infrastructure is crumbling. Take a drive around the country and look for yourself.
6. Please explain exactly why Red states are the TAKER states and Blue States are the Donor states? Why do Alaska, Alabama, Arkansas, Kansas, Mississippi, South Carolina and Tennessee for example pay their bills with money appropriated from California and NY taxpayers? Tht is the true nature of TAKE YOUR GOVERNMENT HANDS OFF MY MEDICARE lying tea bag scum such as yourself.
7. In your analogy YOU are the GERMANS. (I have an undergrad degree in modern German history. Trust me, you are the thug.)
So go sell your garbage somewhere else.
/
Richard Baris / February 28, 2015
I feel truly bad for you. You are an angry, confused, and misinformed pathetic man. I am sorry for you, and pray that your ignorance doesn’t taint others. It won’t, btw.
/
venom / February 28, 2015
You’re a loon moonbat hypocrite…
/
Douglas Bean / March 2, 2015
The housing market collapsed as a direct result of Bill Clinton, Barney Frank, et al forcing lenders to lend to people who could not afford to purchase homes. Their house of cards and the security instruments traded on those mortgages took down the economy of the world.
/
steve schmidt / March 1, 2015
Westerncpl, I adore people like you who have skills at humiliating yourself in public. The economic collapse came from Clinton-Reich who deregulated the banks while also giving us the housing bubble. Facts always confuse people like you, but I will always say in your defense you can only work with the shits fer brains you were born with and cannot help being an idiot.
/
Walter Libby / March 1, 2015
You do know that the capitalists offshored our manufacturing to communist China…
/
Keith / March 2, 2015
Why does your table with numbers comparing the “current recovery” start in 2007? We all know 2008 was a train wreck. It would be interesting to see the numbers starting from 2009, which I suspect would make the period look much more in line with past comparisons.
/