

[show-map id=’8′]
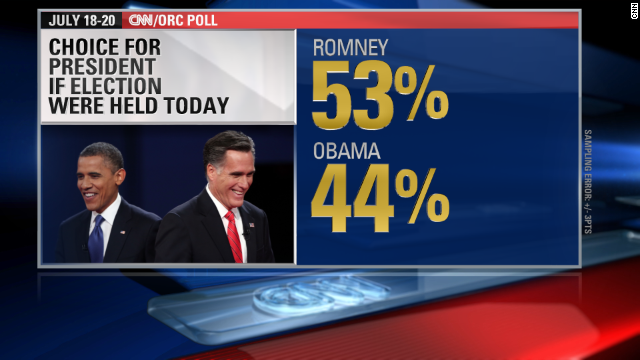
If a rematch of the 2012 presidential election were held today, 2012 GOP nominee Mitt Romney would defeat President Barack Obama in a landslide, according to a CNN poll. This is not the first time a poll has shown a severe case of voter’s remorse among the electorate. A similar ABC News/Washington Post poll conducted in November found that if a rematch of the 2012 election was held, Romney would have defeated Obama by 49 – 45 percent in the popular vote.
Most in the GOP’s Washington D.C.-based consultant class argue that Republican candidates should focus only on a handful of battleground, or purple states in a presidential campaign. However, a PPD study of the results suggest they are making a very expensive mistake.
If a rematch of the 2012 presidential election were held today, GOP nominee Mitt Romney would defeat President Barack Obama in a landslide, according to a CNN poll.
According to the CNN poll conducted by Opinion Research, if the 2012 election were somehow held again in 2014, Romney would garner 53 percent of the popular vote, with President Obama falling extremely short at 44 percent. But how would the Electoral College look, which often varies significantly from the popular vote, and what does it suggest about the future of presidential elections?

Romney/Ryan: 332 Electoral Votes
For instance, President Obama beat Mitt Romney 51 -47 percent in the popular vote back in November 2012. Yet, the Obama/Biden ticket won the Electoral College by a much wider margin, 332 electoral votes to Romney’s 206. If the election were held today, the numbers would be reversed exactly. The Romney/Ryan ticket would have won 332 electoral votes to 206 for the Obama/Biden ticket, but the map would have looked significantly more unified, in true landslide fashion.
Democratic candidates typically begin with somewhere in the neighborhood of 220 – 240 electoral votes, due to larger states like California, New York and Illinois. Under the current consultant strategy, Republican candidates must run the table in all the battleground states in order to win the Electoral College, which our analysis demonstrates is an archaic, losing strategy that sells the Republican Party short.
Obama/Biden: 206 Electoral Votes
Pennsylvania and Minnesota, for instance, are perfect examples of how the Republican Party is leaving millions of popular votes, and dozens of electoral votes, off the table. Even though Gov. Romney barely campaigned in The Keystone State, Obama only carried the state by a relatively small 52 – 46.8 percent margin. Though the GOP nominee did make a late play for Pennsylvania in the closing days of the campaign, it wasn’t enough and, the fact Romney would now carry the state by roughly 4 points should tell the next GOP nominee to dump conventional wisdom.
The same is true for Minnesota, a state David Axelrod was so sure Obama would carry he promised Chris Wallace on Fox News Sunday that he would shave his mustache if the state went for Romney. Axelrod dispatched Bill Clinton to Minnesota in the final weeks of the campaign not because he was sure he was going to keep his mustache, but because he knows what this study concludes, it’s a winnable state for the GOP. In fact, many GOP strategists would be surprised to see that Michigan is still in Obama’s column and, even though the Republican Party consistently prioritizes The Wolverine State over the home of the Vikings, Minnesota has been several points more Republican than Michigan on the presidential level for several cycles.
It is worth mentioning, however, that the simple study simply treated every state the same for purposes of simplicity. In other words, we applied the same popular vote disparity equally to each state, though clearly a 9-point nationwide increase in the popular vote would likely not increase Romney’s already huge margin in states such as Idaho and Utah.
The bottom line is that states that have been reliably Democratic in the past few decades are now becoming opportunities for Republican candidates, if however, they can capitalize on it. We are always listening to pundits talk about the “doomed by demographics” narrative, but as Sean Trende at RCP also pointed out, political coalitions are fluid and there will be realignments that will benefit the Republican Party as they increase their share of the white vote. We saw this play out in the Mid-West states, including Minnesota, Wisconsin, Pennsylvania, Ohio and Iowa, several of which are states that make up the Democratic firewall. Romney was also able to bring New Hampshire back to the GOP and carry Maine’s 2nd Congressional District, chipping off a piece of an otherwise solidly Blue Northeast.
Perhaps even more concerning piece of data for Democrats going forward — as we see under this scenario — is that Romney would be able to peel off Obama voters from all races, including Hispanics, a group that has been pivotal in states Democrats have been able to flip over the past few cycles, such as Nevada and Colorado. These states could potentially move back to the Republican column.
Of course, this is all hypothetical and it is anything but clear whether the GOP would even change course on their losing strategy. Still, as is often the case with post-election knee-jerk analysis, the data suggest the “doomed by demographics” scenario fails to live up to empirical scrutiny.


toto / July 28, 2014
19 states with a total of 242 electoral votes, have voted Democratic, 1992-2012
13 states with 102 electoral votes have voted Republican, 1992-2012
Some states have not been been competitive for more than a half-century and most states now have a degree of partisan imbalance that makes them highly unlikely to be in a swing state position. In a study before the 2012 election:
· 41 States Won by Same Party, 2000-2008
· 32 States Won by Same Party, 1992-2008
· 13 States Won Only by Republican Party, 1980-2008
· 19 States Won Only by Democratic Party, 1992-2008
· 9 Democratic States Not Swing State since 1988
· 15 GOP States Not Swing State since 1988
/
toto / July 28, 2014
The National Popular Vote bill would guarantee the majority of Electoral College votes, and thus the presidency, to the candidate who receives the most popular votes in the country, by replacing state winner-take-all laws for awarding electoral votes.
Every vote, everywhere, would be politically relevant and equal in presidential elections. No more distorting and divisive red and blue state maps of pre-determined outcomes. There would no longer be a handful of ‘battleground’ states where voters and policies are more important than those of the voters in 80% of the states that now are just ‘spectators’ and
ignored after the conventions.
The bill would take effect when enacted by states with a majority of Electoral College votes—that is, enough to elect a President (270 of 538). The candidate receiving the most popular votes from all 50 states (and DC) would get all the 270+ electoral votes of the
enacting states.
The presidential election system, using the 48 state winner-take-all method or district winner method of awarding electoral votes, that we have today was not designed, anticipated, or favored by the Founders. It is the product of decades of change
precipitated by the emergence of political parties and enactment by 48 states of winner-take-all laws, not mentioned, much less endorsed, in the Constitution.
The bill uses the power given to each state by the Founders in the Constitution to change how they award their electoral votes for President. States can, and have, changed their method of awarding electoral votes over the years. Historically, major changes in the method of electing the President, including ending the requirement that only men who owned substantial property could vote and 48 current state-by-state winner-take-all laws, have come about by state legislative action.
In Gallup polls since 1944, only about 20% of the public has supported the current system of awarding all of a state’s electoral votes to the presidential candidate who receives the most votes in each separate state (with about 70% opposed and about 10% undecided).
Support for a national popular vote is strong among Republicans, Democrats, and Independent voters, as well as every demographic group in virtually every state surveyed in recent polls
in recent or past closely divided Battleground states: CO – 68%, FL – 78%, IA –75%, MI – 73%, MO – 70%, NH – 69%, NV – 72%, NM– 76%, NC – 74%, OH – 70%, PA – 78%, VA – 74%, and WI – 71%;
in Small states (3 to 5 electoral votes): AK – 70%, DC – 76%, DE – 75%, ID – 77%, ME – 77%, MT – 72%, NE -74%, NH – 69%, NV – 72%, NM – 76%, OK – 81%, RI – 74%, SD – 71%, UT – 70%, VT – 75%, WV – 81%, and WY – 69%;
in Southern and Border states: AR – 80%, KY- 80%, MS – 77%, MO – 70%, NC – 74%, OK – 81%, SC – 71%, TN – 83%, VA – 74%, and WV – 81%; and
in other states polled: AZ – 67%, CA – 70%, CT – 74%, MA – 73%, MN – 75%, NY – 79%, OR – 76%, and WA – 77%.
Americans believe that the candidate who receives the most votes should win.
The bill has passed 33 state legislative chambers in 22 rural, small, medium, large, red, blue, and purple states with 250 electoral votes. The bill has been enacted by 11 jurisdictions with 165 electoral votes – 61% of the 270 necessary to go into effect.
NationalPopularVote
Follow National Popular Vote on Facebook via NationalPopularVoteInc
/