U.S. Capitol Building in Washington, DC. (Photo: People’s Pundit Daily/Pixabay)
I spend a lot of my time fretting about how federal spending is going to become an ever-larger (and unsustainable) burden in the future.
And I periodically will write about how I wish we still had the very small federal government envisioned by the Founding Fathers (and which largely existed up until the 1920s).
But I haven’t spent that much time looking at how we got to where we are today, other than in 2015 when I cited a very interesting report from the Joint Economic Committee that provided decade-by-decade data on changes in the burden of federal spending.
But I had a chance to touch on this issue in a recent interview when asked to comment on the unfortunate milestone of a $4 trillion federal budget.
Building on that discussion, here are three charts, based on numbers from table 1.3 of OMB’s historical budget data, showing what has happened to federal outlays.
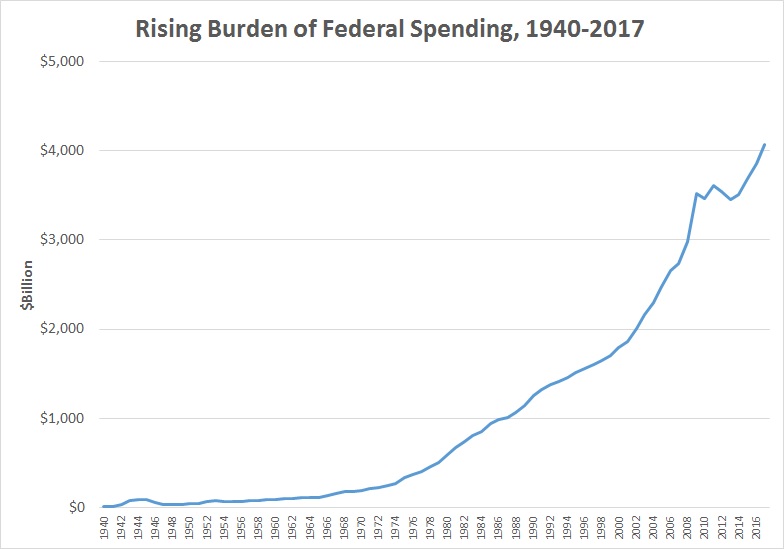
This first graph shows changes in nominal spending over time. As I pointed out in the interview, it took 200 years before the crowd in Washington got spending up to $1 trillion.
But in the past three decades, it has skyrocketed to $4 trillion.
But nominal spending numbers are not the most useful data when looking at long-run changes.
After all, we’ve had lots of inflation. Simply stated, dollars today are worth a lot less than dollars in the past.
So this second chart shows inflation-adjusted federal outlays. As you can see, we have a graph that doesn’t look quite the same. It’s much easier to see the budgetary impact of World War II, for instance, and post-war spending growth isn’t quite as dramatic.
Though it’s still significant. As I noted in the interview, the burden of inflation-adjusted federal spending has doubled since 1985.

But even inflation-adjusted data doesn’t tell the real story.
The most important numbers, at least from an economic perspective, are the ones that measure the burden of federal spending relative to the size of the private economy.
And that’s what I show in this final chart measuring federal spending as a share of economic output (gross domestic product).
Now it’s very easy to see that World War II involved a massive one-time fiscal cost. But the most important data is what happened after the war. The burden of federal outlays initially dropped to 12 percent of GDP. That’s higher than it was before the war, but at least in retrospect not a bad place to be.
Unfortunately, there’s been a gradual expansion in the economic burden of the federal budget ever since.
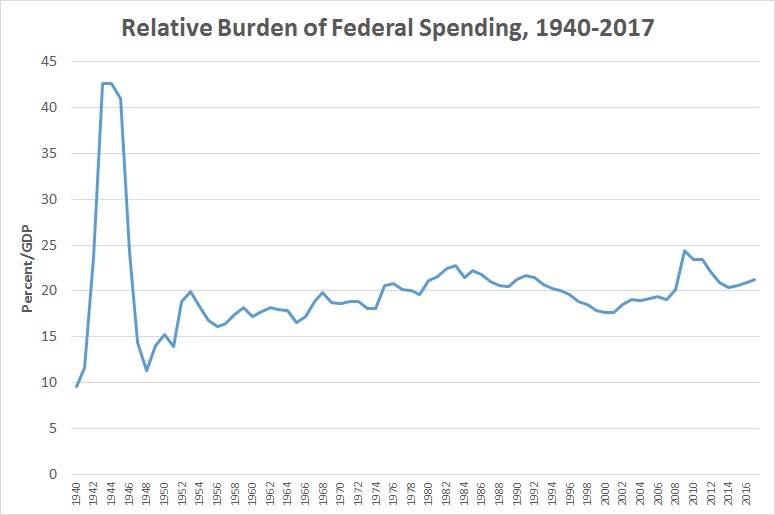
Though if you pay close attention to the numbers, there are some interesting secondary stories. You’ll notice that the negative upward trend was reversed during the Reagan years and we continued to make progress during the Clinton years.
Unfortunately, policy then moved in the wrong direction under Bush and Obama.
Which brings me back to where I started. As bad as the numbers are today, they are likely to get worse in the future because of demographic change and poorly designed entitlement programs. So unless we have genuine entitlement reform, we will become a failed welfare state.