

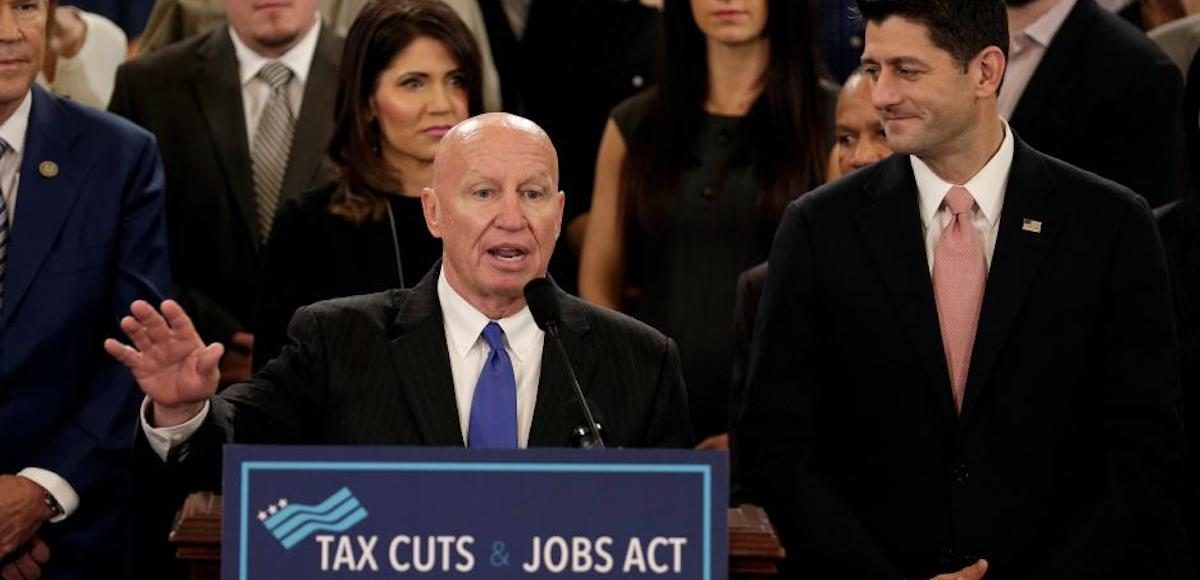

Chairman of the House Ways and Means Committee Kevin Brady (R-TX) and Speaker of the House Paul Ryan (R-WI) and unveil legislation to overhaul the tax code on Capitol Hill in Washington, U.S., November 2, 2017. (Photo: Reuters)
There is a lot of good news about the job market in America.
The official unemployment rate, released just yesterday, is down to 4.1%, which is the lowest its been since the end of the Clinton years. Even more impressive, the number of people getting unemployment benefits (i.e., getting paid not to work) has dropped to the lowest level since the early 1970s.
I don’t want to rain on this parade, but the numbers aren’t as good as they seem.

Back during the Obama years, I repeatedly pointed out the real health of the labor market should be measured by looking at either the rate of labor force participation or the employment-population ratio.
These are the numbers that give us a more accurate picture of the extent to which labor is being productively utilized (remember, national income is determined by the quality and quantity of labor and capital in the economy).
So let’s dig into the government’s database on labor force statistics and see where we stand when examining these more-insightful numbers.
We’ll start with the data on the rate of labor force participation, which is basically a measure of those working and looking for work as a share of the adult population. As you can see, that rate dropped significantly at the end of the Bush years/beginning of the Obama years. And it hasn’t recovered even though the recession ended back in 2009.

By the way, we shouldn’t expect this rate to be 100 percent, or even anywhere close to that high. After all, the 16-and-up population includes plenty of full-time students, retired people, disabled, stay-at-home moms (or dads), and others.
But I worry about the downward trend.
Now let’s look at the employment-population ratio, which is slightly more encouraging. We see a precipitous drop during the recession, but at least the number has been trending in the right direction for several years.

Though it’s nonetheless semi-depressing that the increase has been rather slow and we haven’t come anywhere close to recovering from the downturn.
To help understand the rate of joblessness, here’s a video from the Mercatus Center.
And to better understand the rate of employment, here’s a video from Nicholas Eberstadt at the American Enterprise Institute.
As far as I’m concerned, the key factoid is near the end, where he points out that we would have 10 million additional working-age men productively employed if the rate of employment today was the same as it was in 1965.
And that’s largely the fault of government programs – such as unemployment insurance, disability, Obamacare, licensing, etc – that make it easier for people to choose to be unproductive.
Speaking of which, let’s close with some excerpts from one of Jason Riley’s columns in the Wall Street Journal.
Peter Cove dropped out of a graduate program at the University of Wisconsin-Madison more than 50 years ago to enlist in Lyndon Johnson’s War on Poverty. These days, he’s fighting a war on dependency. …Mr. Cove moved to New York in 1965 to work for the city’s new Anti-Poverty Operations Board… Mr. Cove…noticed… “The government’s unprecedented expenditures failed to bring about the decline in poverty that Johnson had promised. Instead, they made things worse.” Between 1962 and 2012, the percentage of the U.S. population receiving government assistance in the form of cash transfers almost doubled to 21% from 11.7%. …Between 1965 and 2011, the official poverty rate was essentially flat, while government spending per person on poverty programs rose by more than 900% after inflation. “…But as welfare spending soared, the decline in poverty came to a grinding halt.” …Mr. Cove…came to understand that the answer to poverty is prosperity, that the private sector is the better generator of prosperity, and that the best antipoverty program is a job. “Not only does big government get in the way when it provides disincentives to work, it also has a profoundly negative effect on community,”… The increase in government dependency that Mr. Cove laments predates President Obama by decades, but it did accelerate on Mr. Obama’s watch.
Great points, particularly about how the welfare state actually undermined progress on reducing poverty and also eroded societal capital.


Linda / April 7, 2018
If they would move some of those jobs they cannot fill into distressed communities and allow one ti… https://t.co/h1F0x6H6DG
/
Charles G. Hunter / April 7, 2018
WE NEED MORE GOOD JOBS!!
/